


監控維度
- 主機維度
- 主機cpu
- 主機內存
- 主機本地鏡像情況
- 主機上容器運行情況
- 鏡像維度
- 鏡像的基本信息
- 鏡像與容器的基本信息
- 鏡像構建的歷史信息(層級依賴信息)
- 容器維度
- 容器基本信息
- 容器的運行狀態信息
- 容器用量信息
docker監控命令
docker ps
docker images
docker stats
# 注意:docker stats只有選擇libcontainer作爲執行驅動時纔可以使用
# docker stats時常會有一些限制,使用stats api會顯示更多的信息
echo -e "GET /containers/tools/stats HTTP/1.0\r\n" | nc -U /var/run/docker.sock
docker inspac
docker top
docker port
cAdvisor
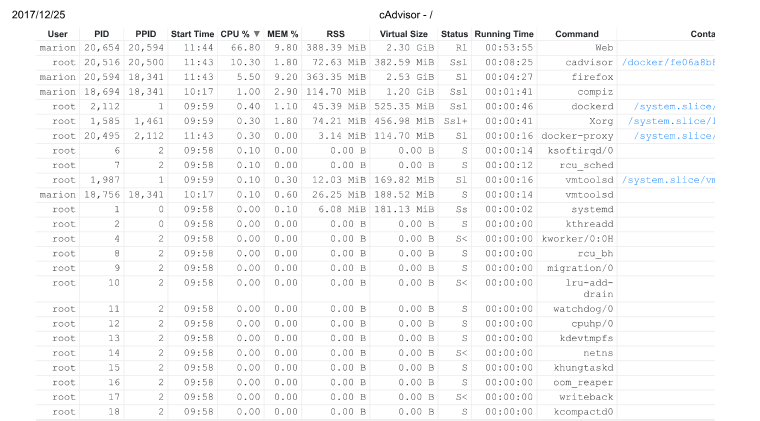
google cAdvisor的一些特性:
- 擁有遠程管理的豐富api支持api docs
- 有web ui管理界面
- 是google除支持k8s外的另一個項目
- 監控信息輸出到influxdb數據庫進行存儲和讀取,支持很多其他的插件
- 支持將容器的統計信息一prometheus標準指標形式輸出並存儲在/metrics HTTP服務端點
sudo docker run \
  --volume=/:/rootfs:ro \
  --volume=/var/run:/var/run:rw \
  --volume=/sys:/sys:ro \
  --volume=/var/lib/docker/:/var/lib/docker:ro \
  --volume=/dev/disk/:/dev/disk:ro \
  --publish=8080:8080 \
  --detach=true \
  --name=cadvisor \
  google/cadvisor:latest
DataDog
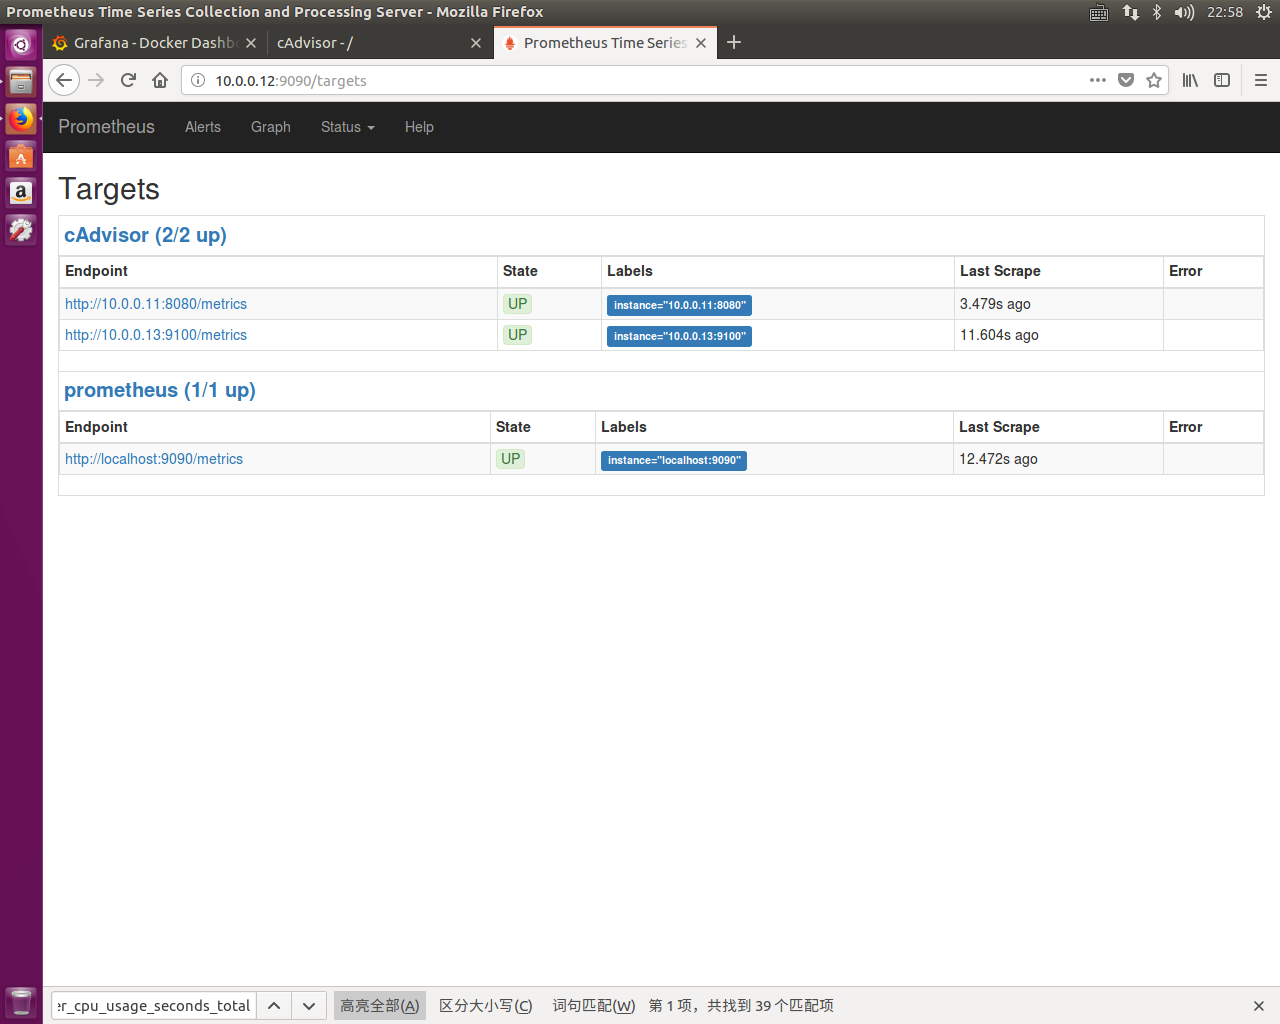
SoundCloud的Promtheus
Promtheus是一個開源服務監控系統與時間序列數據庫,結合exporter使用,exporter是基於prometheus開放的Http接口二次開發用來抓取應用程序的指標數據
Global setting
network configure
docker network create --driver bridge --subnet 10.0.0.0/24 --gateway 10.0.0.1 monitorGrafana configure
# pull grafana image
docker pull grafana/grafana
grafana目錄
- 配置文件
/etc/grafana/ - sqlite3 database file
/var/lib/grafana
grafana在docker中的環境變量
GF_SERVER_ROOT_URL=http://grafana.server.name指定grafana的訪問路徑GF_SECURITY_ADMIN_PASSWORD=secret指定grafana的登錄密碼GF_INSTALL_PLUGINS=grafana-clock-panel,grafana-simple-json-datasource指定安裝插件的變量
構建持久性存儲
docker run \
 -d \
 -v /var/lib/grafana \
 --name grafana-storage \
 busybox:latest
啓動容器
# 啓動Grafana容器
docker run \
 -d \
 -p 3000:3000 \
 --name grafana \
 --volumes-from grafana-storage \
 -e "GF_INSTALL_PLUGINS=grafana-clock-panel,grafana-simple-json-datasource" \
 -e "GF_SERVER_ROOT_URL=http://10.0.0.10:3000" \
 -e "GF_SECURITY_ADMIN_PASSWORD=marion" \
 --network monitor \
 --ip 10.0.0.10 \
 --restart always \
 grafana/grafana

# 查看配置文件以及數據目錄的掛載位置
docker inspect grafana
cAdvisor
sudo docker run \
  --volume=/:/rootfs:ro \
  --volume=/var/run:/var/run:rw \
  --volume=/sys:/sys:ro \
  --volume=/var/lib/docker/:/var/lib/docker:ro \
  --volume=/dev/disk/:/dev/disk:ro \
  --detach=true \
  --name=cadvisor \
  --network monitor \
  --ip 10.0.0.11 \
  google/cadvisor:latest
Deploy by docker-compose yaml file
docker-compose.yml
prometheus:
    image: prom/prometheus:latest
    container_name: monitoring_prometheus
    restart: unless-stopped
    volumes:
      - ./data/prometheus/config:/etc/prometheus/
      - ./data/prometheus/data:/prometheus
    command:
      - '-config.file=/etc/prometheus/prometheus.yml'
      - '-storage.local.path=/prometheus'
      - '-alertmanager.url=http://alertmanager:9093'
    expose:
      - 9090
    ports:
      - 9090:9090
    links:
      - cadvisor:cadvisor
      - node-exporter:node-exporter

  node-exporter:
    image: prom/node-exporter:latest
    container_name: monitoring_node_exporter
    restart: unless-stopped
    expose:
      - 9100

  cadvisor:,
    image: google/cadvisor:latest
    container_name: monitoring_cadvisor
    restart: unless-stopped
    volumes:
      - /:/rootfs:ro
      - /var/run:/var/run:rw
      - /sys:/sys:ro
      - /var/lib/docker/:/var/lib/docker:ro
    expose:
      - 8080

  grafana:
    image: grafana/grafana:latest
    container_name: monitoring_grafana
    restart: unless-stopped
    links:
      - prometheus:prometheus
    volumes:
      - ./data/grafana:/var/lib/grafana
    environment:
      - GF_SECURITY_ADMIN_PASSWORD=MYPASSWORT
      - GF_USERS_ALLOW_SIGN_UP=false
      - GF_SERVER_DOMAIN=myrul.com
      - GF_SMTP_ENABLED=true
      - GF_SMTP_HOST=smtp.gmail.com:587
      - [email protected]
      - GF_SMTP_PASSWORD=mypassword
      - [email protected]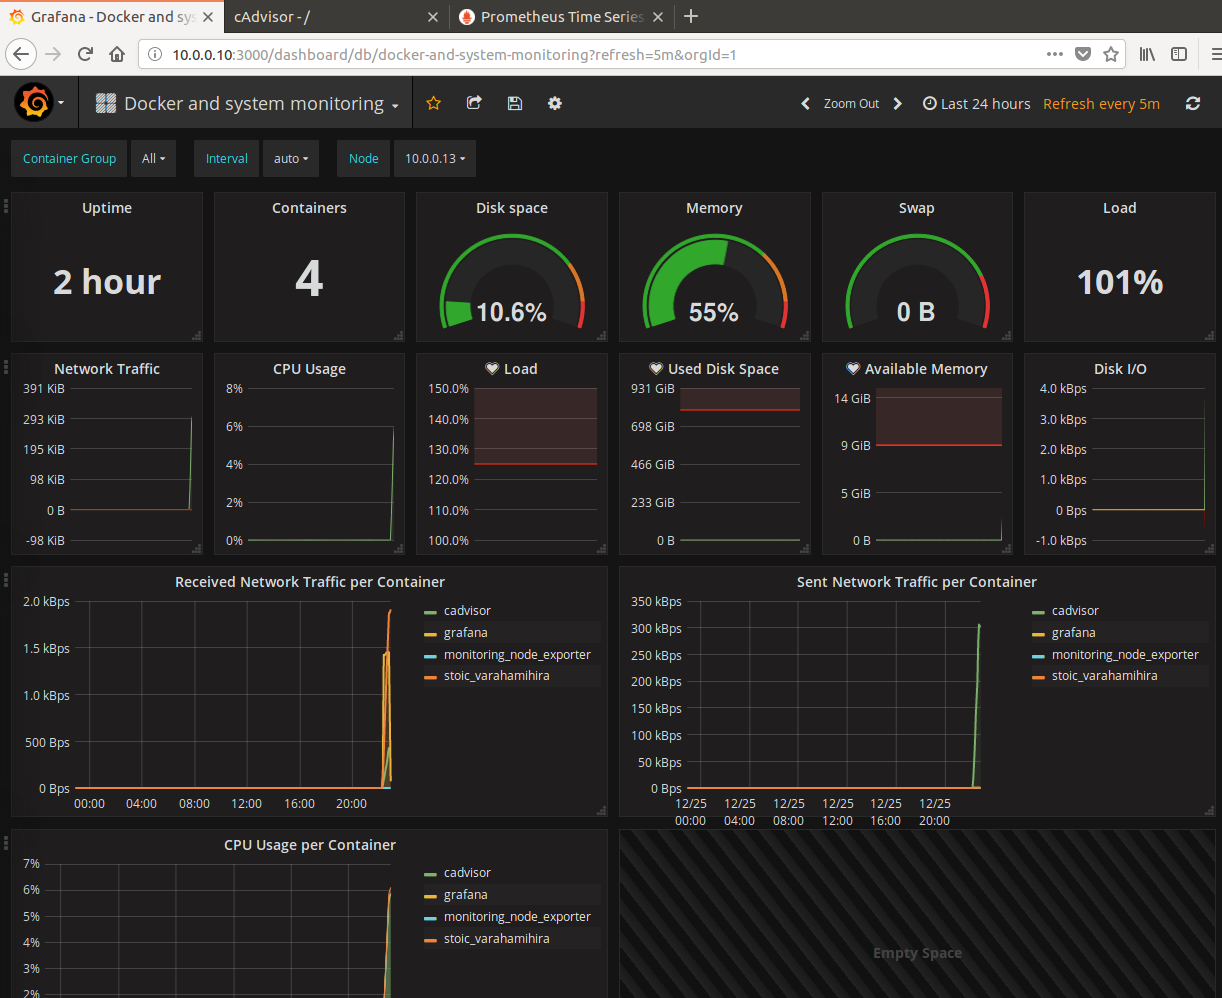
prometheus.yml
# my global config
global:
  scrape_interval:     120s # By default, scrape targets every 15 seconds.
  evaluation_interval: 120s # By default, scrape targets every 15 seconds.
  # scrape_timeout is set to the global default (10s).

  # Attach these labels to any time series or alerts when communicating with
  # external systems (federation, remote storage, Alertmanager).
  external_labels:
      monitor: 'my-project'

# Load and evaluate rules in this file every 'evaluation_interval' seconds.
rule_files:
  # - "alert.rules"
  # - "first.rules"
  # - "second.rules"

# A scrape configuration containing exactly one endpoint to scrape:
# Here it's Prometheus itself.
scrape_configs:
  # The job name is added as a label `job=<job_name>` to any timeseries scraped from this config.
  - job_name: 'prometheus'

    # Override the global default and scrape targets from this job every 5 seconds.
    scrape_interval: 120s

    # metrics_path defaults to '/metrics'
    # scheme defaults to 'http'.

    static_configs:
         - targets: ['localhost:9090','cadvisor:8080','node-exporter:9100', 'nginx-exporter:9113']
command
docker-compose up -dsysdig
docker pull sysdig/sysdig
docker run -i -t --name sysdig --privileged -v /var/run/docker.sock:/host/var/run/docker.sock -v /dev:/host/dev -v /proc:/host/proc:ro -v /boot:/host/boot:ro -v /lib/modules:/host/lib/modules:ro -v /usr:/host/usr:ro sysdig/sysdig

docker container exec -it sysdig bash
csysdig