


一、Prometheus概述
Prometheus是一個開源的系統監視和警報工具包,自2012成立以來,許多公司和組織採用了Prometheus。它現在是一個獨立的開源項目,並獨立於任何公司維護。
在2016年,Prometheus加入雲計算基金會作爲Kubernetes之後的第二託管項目。
特點:
- 多維數據模型(有metric名稱和鍵值對確定的時間序列)
- 靈活的查詢語言
- 不依賴分佈式存儲
- 通過pull方式採集時間序列,通過http協議傳輸
- 支持通過中介網關的push時間序列的方式
- 監控數據通過服務或者靜態配置來發現
- 支持圖表和dashboard等多種方式
組件:
- Prometheus 主程序,主要是負責存儲、抓取、聚合、查詢方面。
- Alertmanager 程序,主要是負責實現報警功能。
- Pushgateway 程序,主要是實現接收由Client push過來的指標數據,在指定的時間間隔,由主程序來抓取。
- node_exporter 這類是不同系統已經實現了的集成。
架構圖
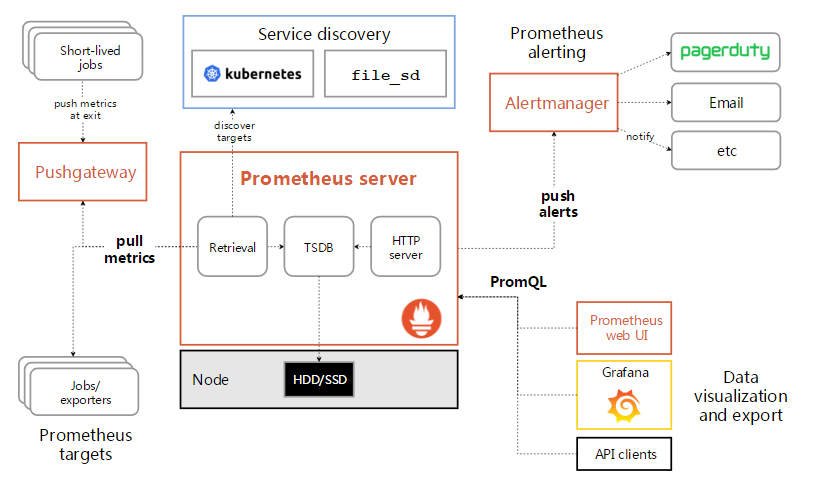
工作流程
- Prometheus 服務器定期從配置好的 jobs 或者 exporters 中獲取度量數據;或者接收來自推送網關發送過來的 度量數據。
- Prometheus 服務器在本地存儲收集到的度量數據,並對這些數據進行聚合;
- 運行已定義好的 alert.rules,記錄新的時間序列或者向告警管理器推送警報。
- 告警管理器根據配置文件,對接收到的警報進行處理,並通過email等途徑發出告警。
- Grafana等圖形工具獲取到監控數據,並以圖形化的方式進行展示。
二、Prometheus安裝及配置
1、下載及解壓安裝包
wget https://github.com/prometheus/prometheus/releases/download/v2.5.0/prometheus-2.5.0.linux-amd64.tar.gz

groupadd prometheus
useradd -g prometheus prometheus -d /app/prometheus

tar -xvf prometheus-2.5.0.linux-amd64.tar.gz
cd prometheus-2.5.0.linux-amd64/
mv * /app/prometheus/

cd /app/prometheus/
mkdir {data,cfg,logs,bin} -p
mv prometheus promtool bin/
mv prometheus.yml cfg/

chown -R prometheus.prometheus *
2 、設置環境變量
vim /etc/profile
PATH=/app/prometheus/bin:$PATH:$HOME/bin
source /etc/profile
3、檢查配置文件
# promtool check config /app/prometheus/config/prometheus.yml
Checking /app/prometheus/config/prometheus.yml
  SUCCESS: 0 rule files found
4、創建prometheus.service 的 systemd unit 文件
vim /etc/systemd/system/prometheus.service

[Unit]
Description=Prometheus
Documentation=https://prometheus.io/
After=network.target

[Service]
Type=simple
User=prometheus
ExecStart=/app/prometheus/bin/prometheus --config.file=/app/prometheus/cfg/prometheus.yml --storage.tsdb.path=/app/prometheus/data
Restart=on-failure

[Install]
WantedBy=multi-user.target
5、啓動服務
systemctl daemon-reload
systemctl enable prometheus.service
systemctl start prometheus.service
6、運行狀態
# systemctl status prometheus.service
● prometheus.service - Prometheus
   Loaded: loaded (/etc/systemd/system/prometheus.service; enabled; vendor preset: disabled)
   Active: active (running) since 日 2018-12-09 22:21:52 CST; 4min 59s ago
     Docs: https://prometheus.io/
 Main PID: 1308 (prometheus)
   CGroup: /system.slice/prometheus.service
           └─1308 /app/prometheus/bin/prometheus --config.file=/app/prometheus/cfg/prometheus.yml --storage.tsdb.path=/app/prometheus/data

12月 09 22:21:52 qas-prometheus prometheus[1308]: level=info ts=2018-12-09T14:21:52.190312051Z caller=main.go:245 build_context="(go=go1.11.1, user=root@578ab108d0b9, date=20...-11:40:44)"
12月 09 22:21:52 qas-prometheus prometheus[1308]: level=info ts=2018-12-09T14:21:52.190327105Z caller=main.go:246 host_details="(Linux 3.10.0-862.el7.x86_64 #1 SMP Fri Apr 20...us (none))"
12月 09 22:21:52 qas-prometheus prometheus[1308]: level=info ts=2018-12-09T14:21:52.190342191Z caller=main.go:247 fd_limits="(soft=1024, hard=4096)"
12月 09 22:21:52 qas-prometheus prometheus[1308]: level=info ts=2018-12-09T14:21:52.190351846Z caller=main.go:248 vm_limits="(soft=unlimited, hard=unlimited)"
12月 09 22:21:52 qas-prometheus prometheus[1308]: level=info ts=2018-12-09T14:21:52.192559162Z caller=main.go:562 msg="Starting TSDB ..."
12月 09 22:21:52 qas-prometheus prometheus[1308]: level=info ts=2018-12-09T14:21:52.204059097Z caller=main.go:572 msg="TSDB started"
12月 09 22:21:52 qas-prometheus prometheus[1308]: level=info ts=2018-12-09T14:21:52.204101343Z caller=main.go:632 msg="Loading configuration file" filename=/app/prometheus/cf...metheus.yml
12月 09 22:21:52 qas-prometheus prometheus[1308]: level=info ts=2018-12-09T14:21:52.204905309Z caller=main.go:658 msg="Completed loading of configuration file" filename=/app/...metheus.yml
12月 09 22:21:52 qas-prometheus prometheus[1308]: level=info ts=2018-12-09T14:21:52.204919014Z caller=main.go:531 msg="Server is ready to receive web requests."
12月 09 22:21:52 qas-prometheus prometheus[1308]: level=info ts=2018-12-09T14:21:52.20493548Z caller=web.go:399 component=web msg="Start listening for connections" address=0.0.0.0:9090
Hint: Some lines were ellipsized, use -l to show in full.Prometheus自帶有簡單的UI,http://172.16.8.253:9090/

三、node_exporter安裝及配置
1、下載及解壓安裝包
wget https://github.com/prometheus/node_exporter/releases/download/v0.17.0/node_exporter-0.17.0.linux-amd64.tar.gztar -xvf node_exporter-0.17.0.linux-amd64.tar.gz -C /app/prometheus/
cd /app/prometheus/
mv node_exporter-0.17.0.linux-amd64 node_exporter
2、創建用戶
groupadd prometheus
useradd -g prometheus prometheus -d /app/prometheus
chown -R prometheus.prometheus node_exporter
3、創建node_exporter.service的 systemd unit 文件
# vim /usr/lib/systemd/system/node_exporter.service

[Unit]
Description=node_exporter
Documentation=https://prometheus.io/
After=network.target

[Service]
Type=simple
User=prometheus
ExecStart=/app/prometheus/node_exporter/node_exporter
Restart=on-failure

[Install]
WantedBy=multi-user.target
4、啓動服務
systemctl daemon-reload
systemctl enable node_exporter.service
systemctl start node_exporter.service
5、運行狀態
]# systemctl status node_exporter.service
● node_exporter.service - node_exporter
   Loaded: loaded (/usr/lib/systemd/system/node_exporter.service; enabled; vendor preset: disabled)
   Active: active (running) since 日 2018-12-09 22:45:10 CST; 4min 8s ago
     Docs: https://prometheus.io/
 Main PID: 1515 (node_exporter)
   CGroup: /system.slice/node_exporter.service
           └─1515 /app/prometheus/node_exporter/node_exporter

12月 09 22:45:10 qas-prometheus node_exporter[1515]: time="2018-12-09T22:45:10+08:00" level=info msg=" - sockstat" source="node_exporter.go:97"
12月 09 22:45:10 qas-prometheus node_exporter[1515]: time="2018-12-09T22:45:10+08:00" level=info msg=" - stat" source="node_exporter.go:97"
12月 09 22:45:10 qas-prometheus node_exporter[1515]: time="2018-12-09T22:45:10+08:00" level=info msg=" - textfile" source="node_exporter.go:97"
12月 09 22:45:10 qas-prometheus node_exporter[1515]: time="2018-12-09T22:45:10+08:00" level=info msg=" - time" source="node_exporter.go:97"
12月 09 22:45:10 qas-prometheus node_exporter[1515]: time="2018-12-09T22:45:10+08:00" level=info msg=" - timex" source="node_exporter.go:97"
12月 09 22:45:10 qas-prometheus node_exporter[1515]: time="2018-12-09T22:45:10+08:00" level=info msg=" - uname" source="node_exporter.go:97"
12月 09 22:45:10 qas-prometheus node_exporter[1515]: time="2018-12-09T22:45:10+08:00" level=info msg=" - vmstat" source="node_exporter.go:97"
12月 09 22:45:10 qas-prometheus node_exporter[1515]: time="2018-12-09T22:45:10+08:00" level=info msg=" - xfs" source="node_exporter.go:97"
12月 09 22:45:10 qas-prometheus node_exporter[1515]: time="2018-12-09T22:45:10+08:00" level=info msg=" - zfs" source="node_exporter.go:97"
12月 09 22:45:10 qas-prometheus node_exporter[1515]: time="2018-12-09T22:45:10+08:00" level=info msg="Listening on :9100" source="node_exporter.go:111"
6、客戶監控端數據彙報
訪問:http://172.16.8.253:9100/metrics,查看從exporter具體能抓到的數據.如下:

四、Grafana安裝及配置
1、下載及安裝
wget https://dl.grafana.com/oss/release/grafana-5.4.0-1.x86_64.rpm
yum localinstall grafana-5.4.0-1.x86_64.rpm
2、啓動服務
systemctl daemon-reload
systemctl enable grafana-server.service
systemctl start grafana-server.service
3、訪問WEB界面
默認賬號/密碼:admin/admin
http://172.16.9.253:3000
4、Grafana添加數據源
在登陸首頁,點擊"Configuration-Data Sources"按鈕,跳轉到添加數據源頁面,配置如下:
Name: prometheus
Type: prometheus
URL: http://172.16.9.253:9090/
Access: Server
取消Default的勾選,其餘默認,點擊"Add",如下:

在"Dashboards"頁簽下"import"自帶的模版,如下: