#!/usr/bin/python
#coding:utf-8
import urllib2
import json
import argparse
import xlrd
def authenticate(url, username, password):
values = {'jsonrpc': '2.0',
'method': 'user.login',
'params': {
'user': username,
'password': password
},
'id': '0'
}
data = json.dumps(values)
req = urllib2.Request(url, data, {'Content-Type': 'application/json-rpc'})
response = urllib2.urlopen(req, data)
output = json.loads(response.read())
try:
message = output['result']
except:
message = output['error']['data']
print message
quit()
return output['result']
def getGraph(hostname, url, auth, graphtype, dynamic, columns):
if (graphtype == 0):
selecttype = ['graphid']
select = 'selectGraphs'
if (graphtype == 1):
selecttype = ['itemid', 'value_type']
select = 'selectItems'
values = {'jsonrpc': '2.0',
'method': 'host.get',
'params': {
select: selecttype,
'output': ['hostid', 'host'],
'searchByAny': 1,
'filter': {
'host': hostname
}
},
'auth': auth,
'id': '2'
}
data = json.dumps(values)
req = urllib2.Request(url, data, {'Content-Type': 'application/json-rpc'})
response = urllib2.urlopen(req, data)
host_get = response.read()
output = json.loads(host_get)
# print json.dumps(output)
graphs = []
if (graphtype == 0):
for i in output['result'][0]['graphs']:
graphs.append(i['graphid'])
if (graphtype == 1):
for i in output['result'][0]['items']:
if int(i['value_type']) in (0, 3):
graphs.append(i['itemid'])
graph_list = []
x = 0
y = 0
for graph in graphs:
graph_list.append({
"resourcetype": graphtype,
"resourceid": graph,
"width": "320",
"height": "100",
"x": str(x),
"y": str(y),
"colspan": "1",
"rowspan": "1",
"elements": "0",
"valign": "0",
"halign": "0",
"style": "0",
"url": "",
"dynamic": str(dynamic)
})
x += 1
if x == columns:
x = 0
y += 1
return graph_list
def screenCreate(url, auth, screen_name, graphids, columns):
# print graphids
if len(graphids) % columns == 0:
vsize = len(graphids) / columns
else:
vsize = (len(graphids) / columns) + 1 # vsize代表行數,它的值必須在1-100 之間。
values = {"jsonrpc": "2.0",
"method": "screen.create",
"params": [{
"name": screen_name,
"hsize": columns,
"vsize": vsize,
"screenitems": []
}],
"auth": auth,
"id": 2
}
for i in graphids:
values['params'][0]['screenitems'].append(i)
data = json.dumps(values)
req = urllib2.Request(url, data, {'Content-Type': 'application/json-rpc'})
response = urllib2.urlopen(req, data)
host_get = response.read()
output = json.loads(host_get)
try:
message = output['result']
except:
message = output['error']['data']
print json.dumps(message)
def main(input_hostname, input_hostgroup):
url = 'http://10.6.32.110/zabbix/api_jsonrpc.php'
username = "admin"
password = "hc360tc123"
hostname = input_hostname
screen_name = input_hostgroup
columns = 4 #聚合圖形的列數,這裏可以修改。和vsize配合使用,
dynamic = 0
screentype = 0
auth = authenticate(url, username, password)
graphids = getGraph(hostname, url, auth, screentype, dynamic, columns)
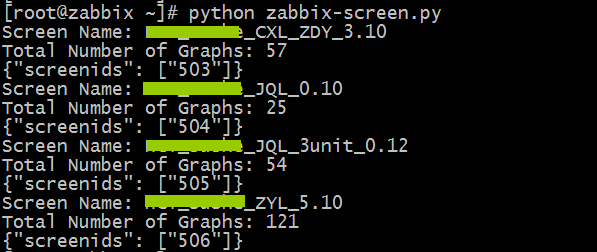
print "Screen Name: " + screen_name
print "Total Number of Graphs: " + str(len(graphids))
screenCreate(url, auth, screen_name, graphids, columns)
if __name__ == '__main__':
workbook = xlrd.open_workbook('add-host-2.xlsx') #Excel名
for row in xrange(workbook.sheets()[0].nrows):
hostname = workbook.sheets()[0].cell(row, 0).value
hostgroup = workbook.sheets()[0].cell(row, 1).value
main(hostname, hostgroup)
# columns和vsize如何配合使用。
# columns代表形成聚合圖形的列數。
# vsize代表形成聚合圖形的行數,而zabbix限制行數在 1-100之間。
# vsize = 每個主機的圖片數量 / columns
# 例如:使用columns = 2 ;主機的圖片數量爲400 ;vsize= 400/2=200 ;
# 當vsize大於100 ,執行腳本會報錯。 那麼就需要將columns 改成 4 ,vsize = 400/4=100
腳本運行:
表格格式參考 zabbix批量添加主機:http://blog.51cto.com/506554897/2350269
![zabbix批量創建聚合圖形]()