前言:
- 雖然作者已經推出了docker版本,只需一鍵(一條命令)即可完成搭建。
- 但是本着學習的心理還是要自己折騰一遍,一鍵雖好但不明瞭啊。
- 官方已經把安裝寫的很詳細了,但畢竟是英文......
- pgwatch2官方地址:https://github.com/cybertec-postgresql/pgwatch2
系統環境:
CentOS 7.5
IP:192.168.1.2

grafana-5.1.4
PostgreSQL-10、pg_stat_statements模塊
InfluxDB-1.5.3
Python3

#關閉selinux以及firewalld。
##自行安裝以上應用!!!本文不提供安裝過程!!!
一、配置PostgreSQL
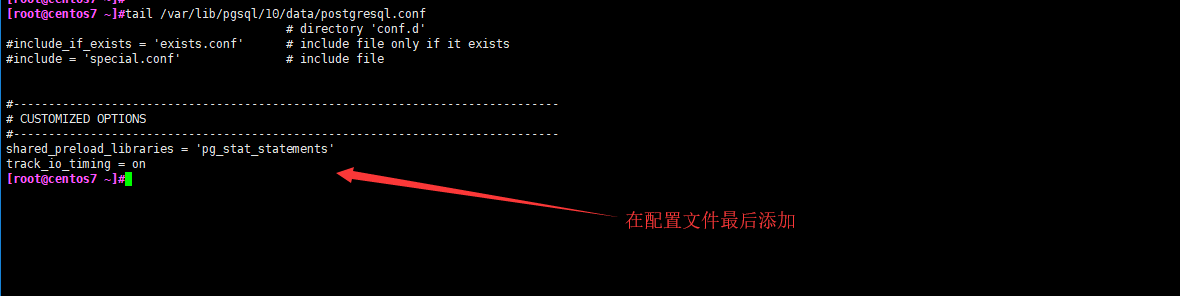
vi /var/lib/pgsql/10/data/postgresql.conf
shared_preload_libraries = 'pg_stat_statements'
track_io_timing = on
#編輯postgresql.conf配置文件,添加如下兩行(前提:裝好pg_stat_statements模塊
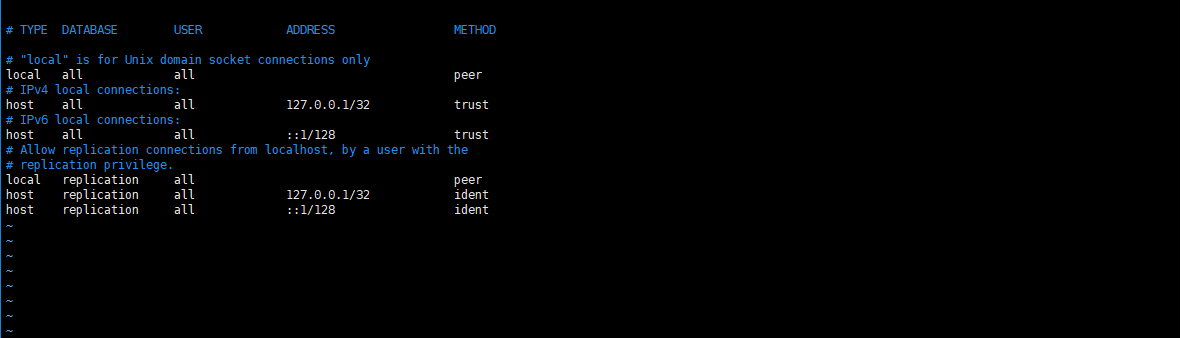
vi /var/lib/pgsql/10/data/pg_hba.conf
local all all peer
host all all 127.0.0.1/32 trust
host all all ::1/128 trust
#修改認證模式,通過127.0.0.1訪問的用戶不需要密碼認證
#爲了安全請自行配置,pg_hba.conf配置文件詳解請自行百度~~
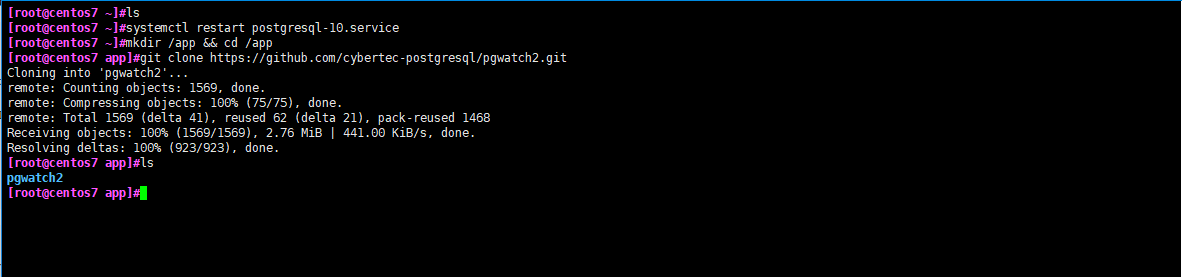
systemctl restart postgresql-10.service

#重啓數據庫

mkdir /app && cd /app
git clone https://github.com/cybertec-postgresql/pgwatch2.git

#克隆源碼倉庫,有一些東西需要用到。
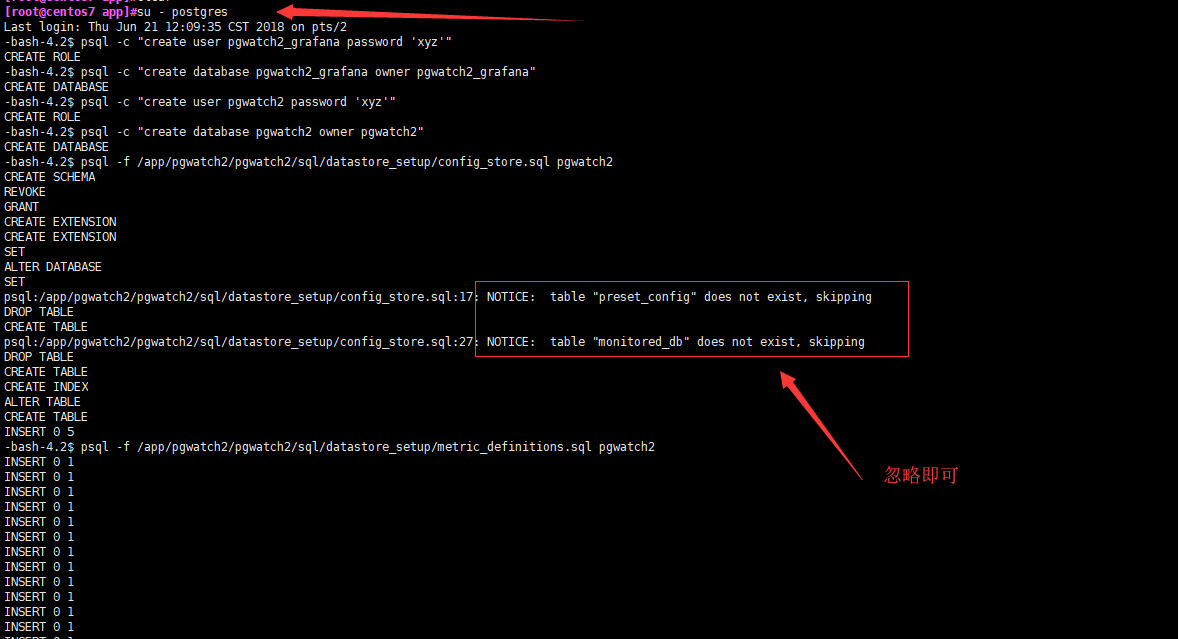
su - postgres
psql -c "create user pgwatch2_grafana password 'xyz'"
psql -c "create database pgwatch2_grafana owner pgwatch2_grafana"

psql -c "create user pgwatch2 password 'xyz'"
psql -c "create database pgwatch2 owner pgwatch2"

psql -f /app/pgwatch2/pgwatch2/sql/datastore_setup/config_store.sql pgwatch2
psql -f /app/pgwatch2/pgwatch2/sql/datastore_setup/metric_definitions.sql pgwatch2

#切換至postgre用戶以便操作數據庫。
#創建pgwatch2_grafana、pgwatch2用戶並設置密碼。
#創建pgwatch2_grafana、pgwatch2數據庫並設置所屬主。
#導入pgwatch2的數據。
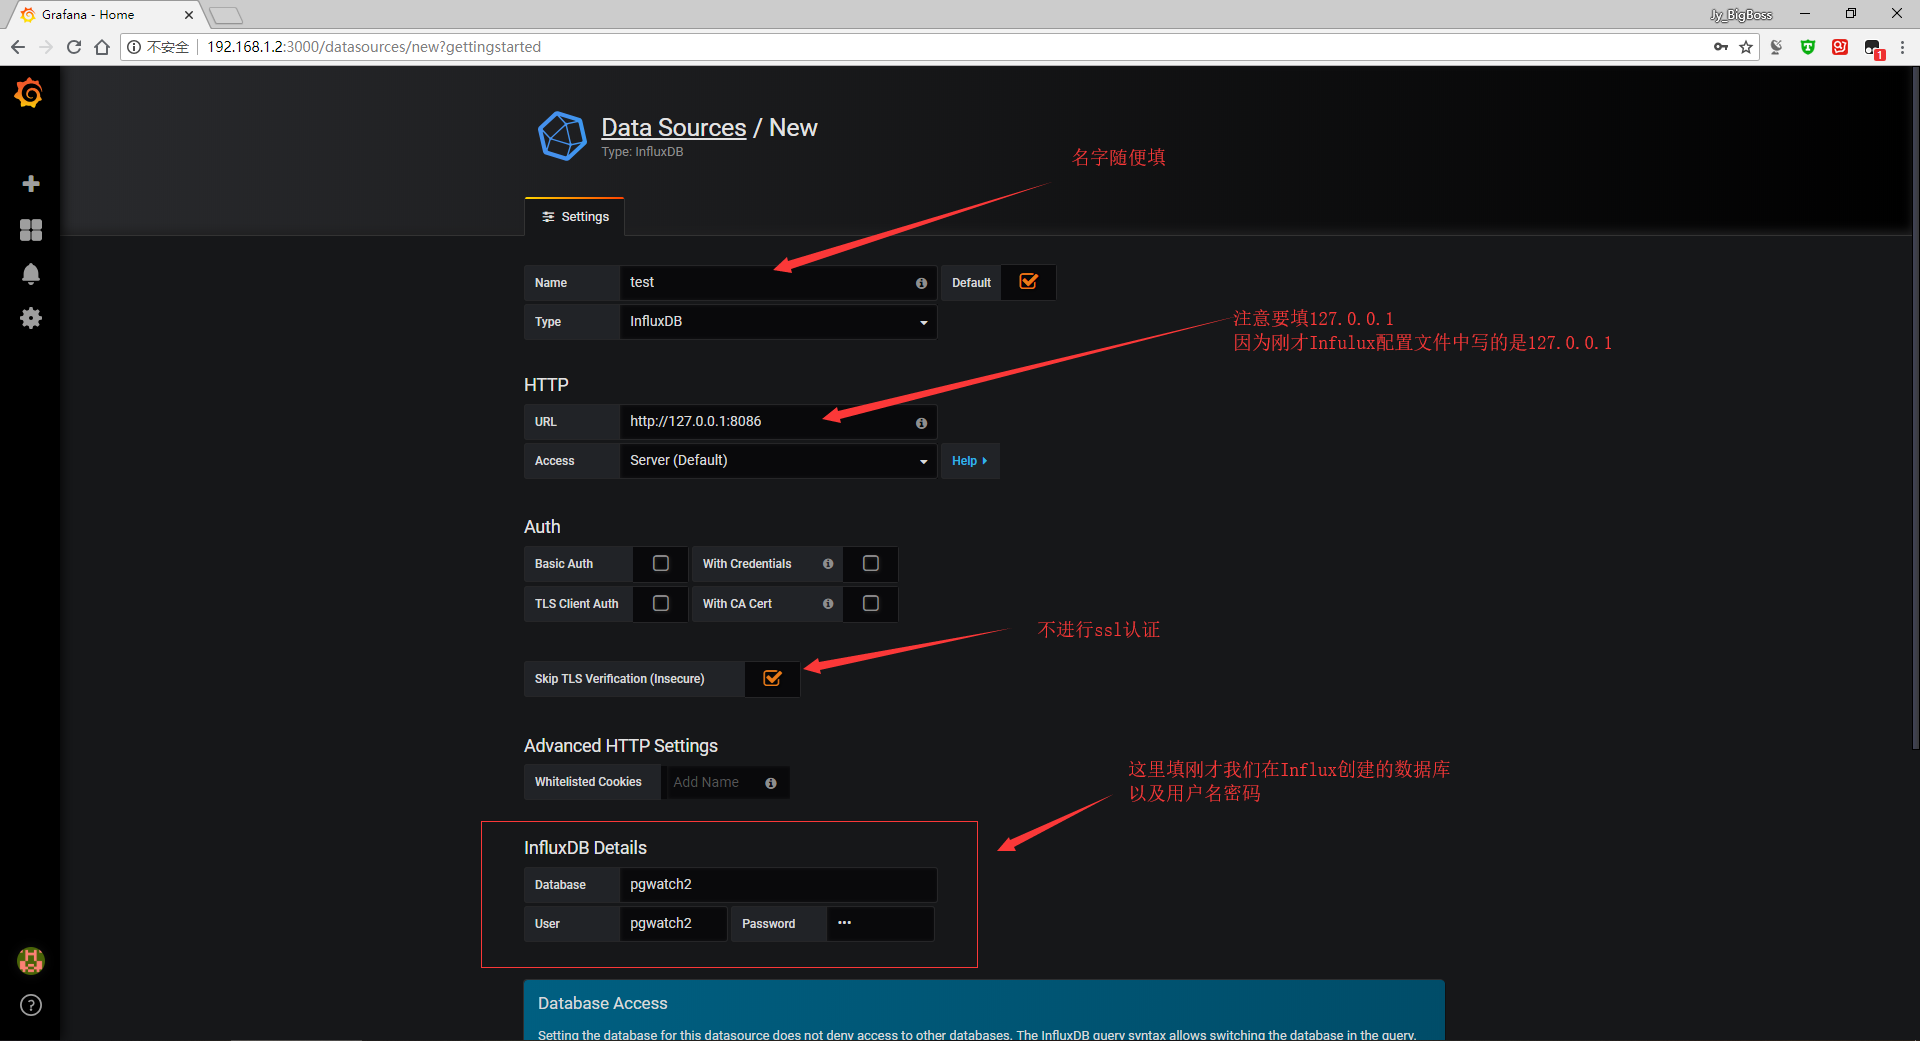
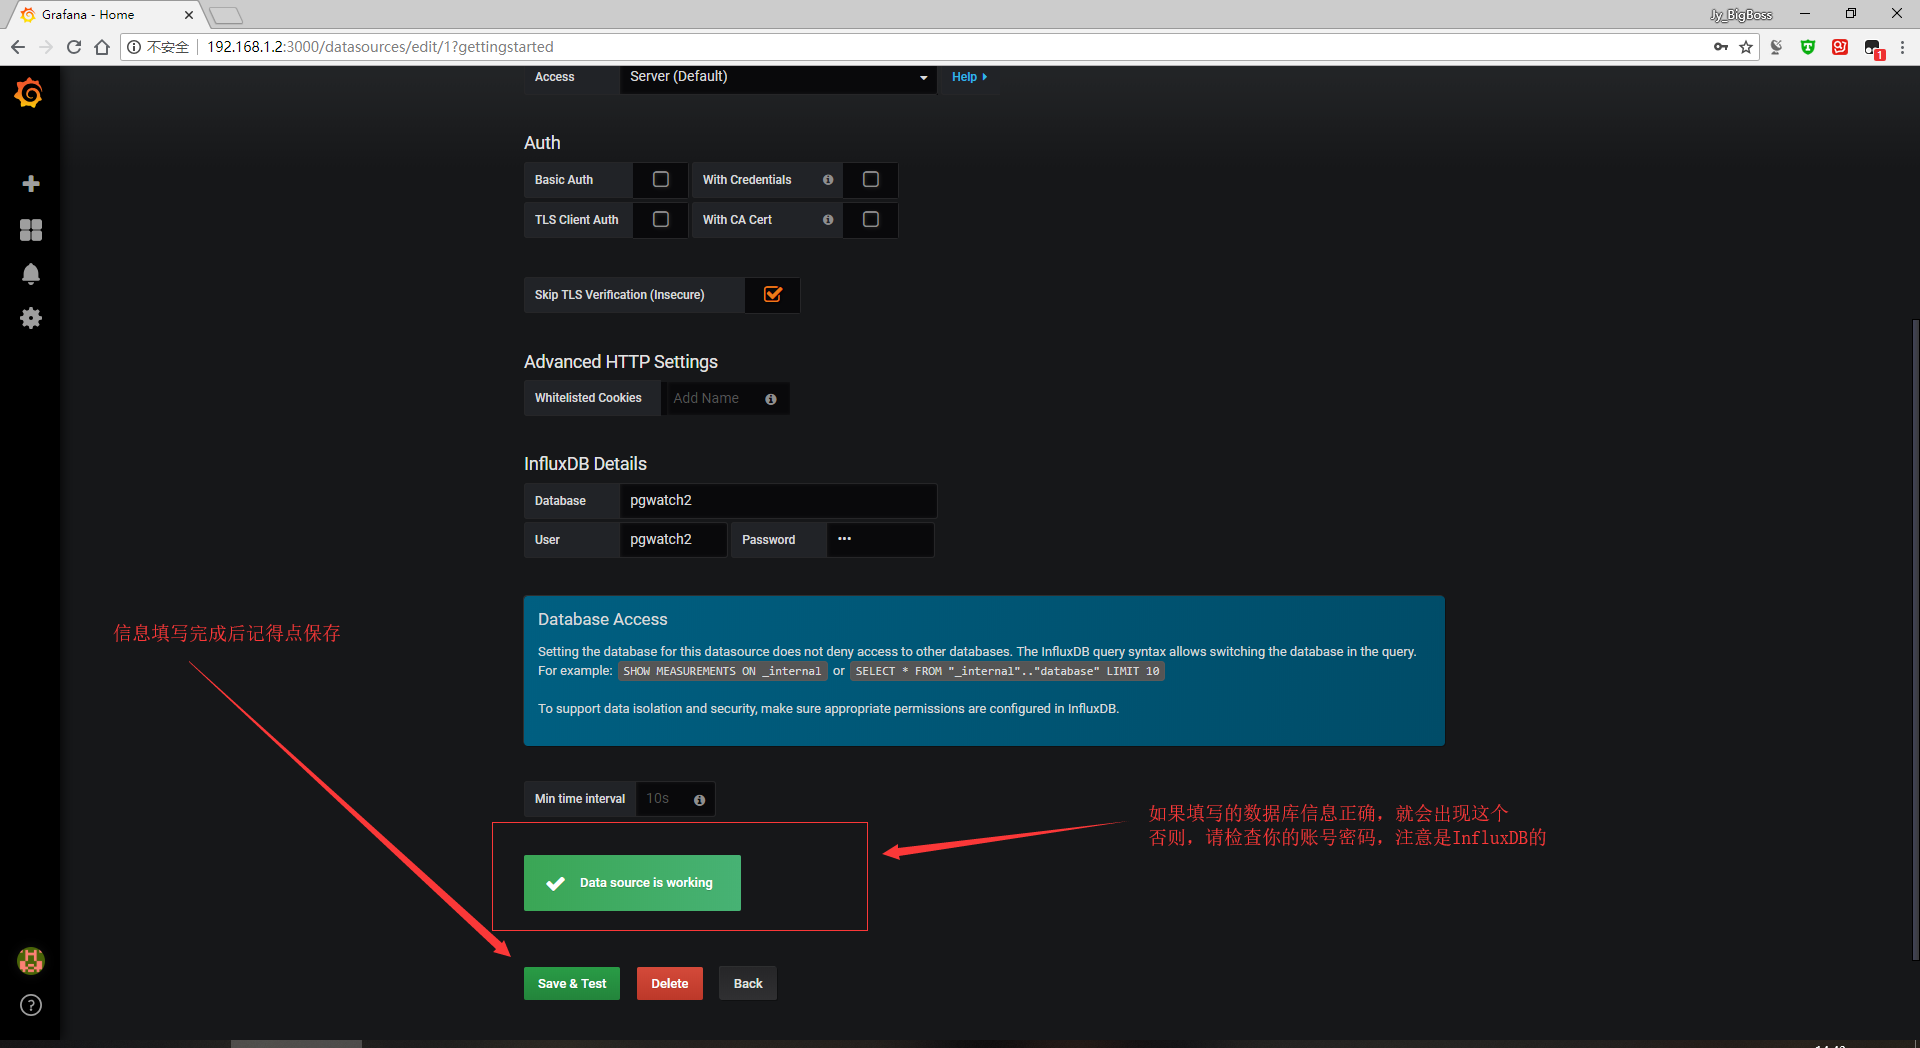
二、配置InfluxDB
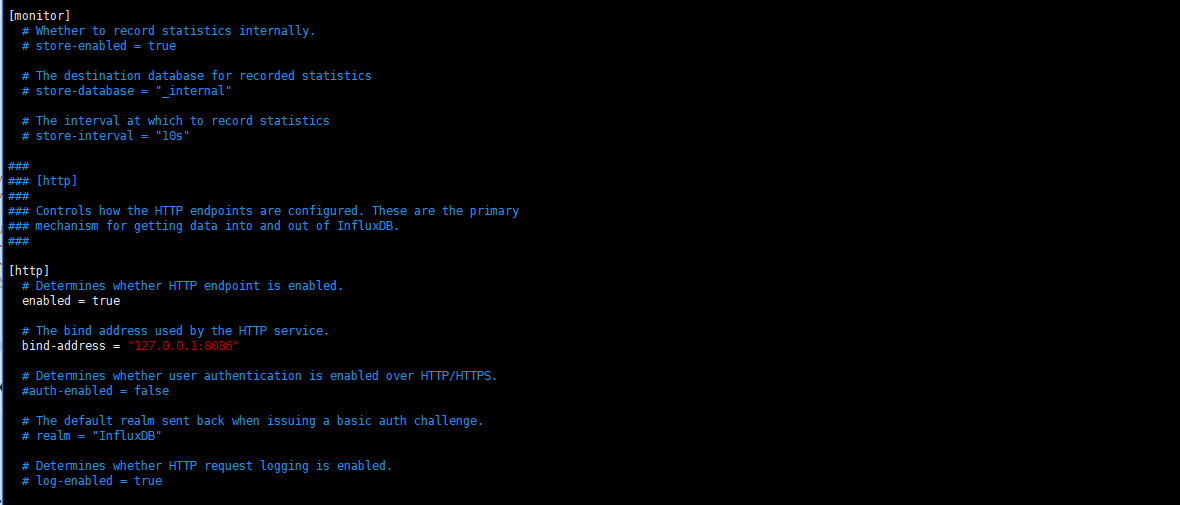
vi /etc/influxdb/influxdb.conf

[http]
enabled = true
bind-address = "127.0.0.1:8086"

#修改配置文件,將http端的bind-address修改成127.0.0.1
#因爲是做監控用的,所以不做認證,但僅允許本地地址訪問。

systemctl start influxdb

#啓動InfluxDB
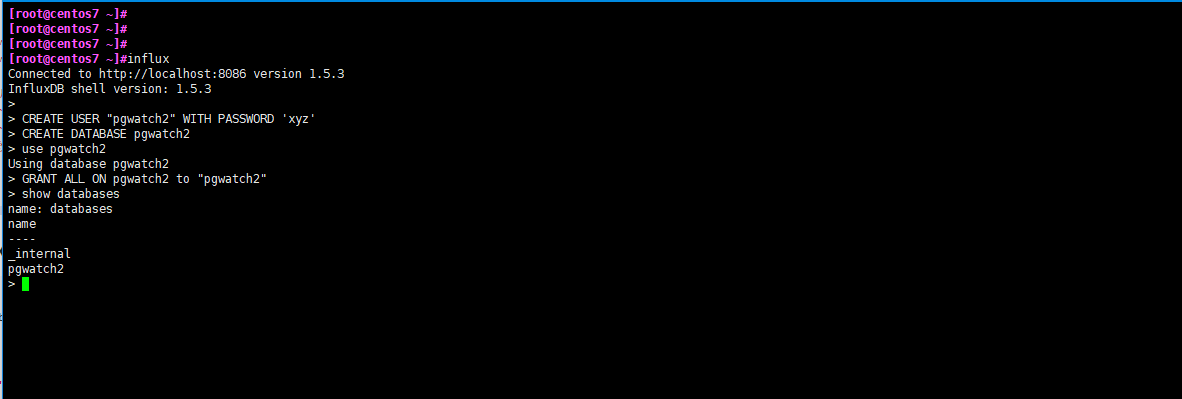
influx

CREATE USER "pgwatch2" WITH PASSWORD 'xyz'
CREATE DATABASE pgwatch2
use pgwatch2
GRANT ALL ON pgwatch2 to "pgwatch2"

#創建pgwatch2用戶以及同名的數據庫,並且授權。
三、配置Grafana
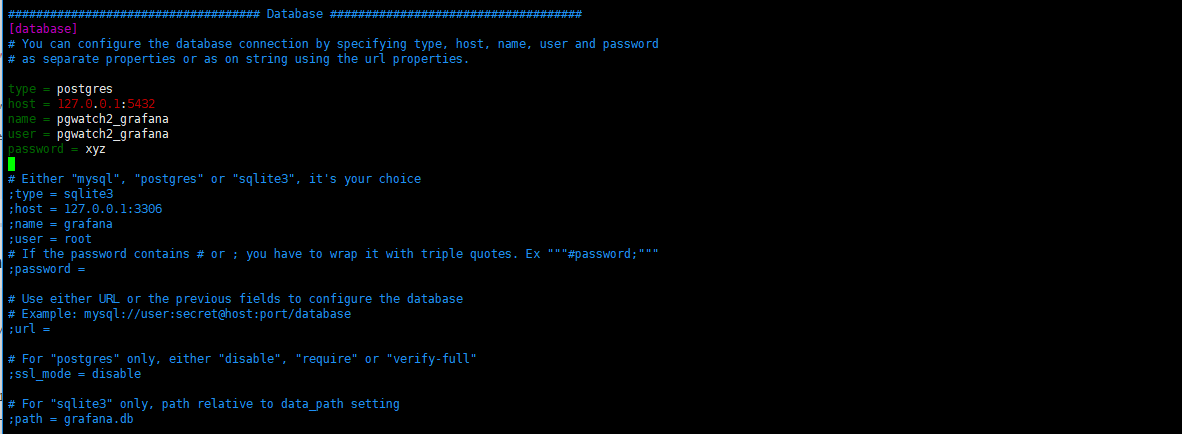
vi /etc/grafana/grafana.ini

[database]
type = postgres
host = 127.0.0.1:5432
name = pgwatch2_grafana
user = pgwatch2_grafana
password = xyz

#將Grafana的數據存入postgresql

http://192.168.1.2:3000
#訪問Grafana的web頁面進行配置
#默認用戶名與密碼:admin
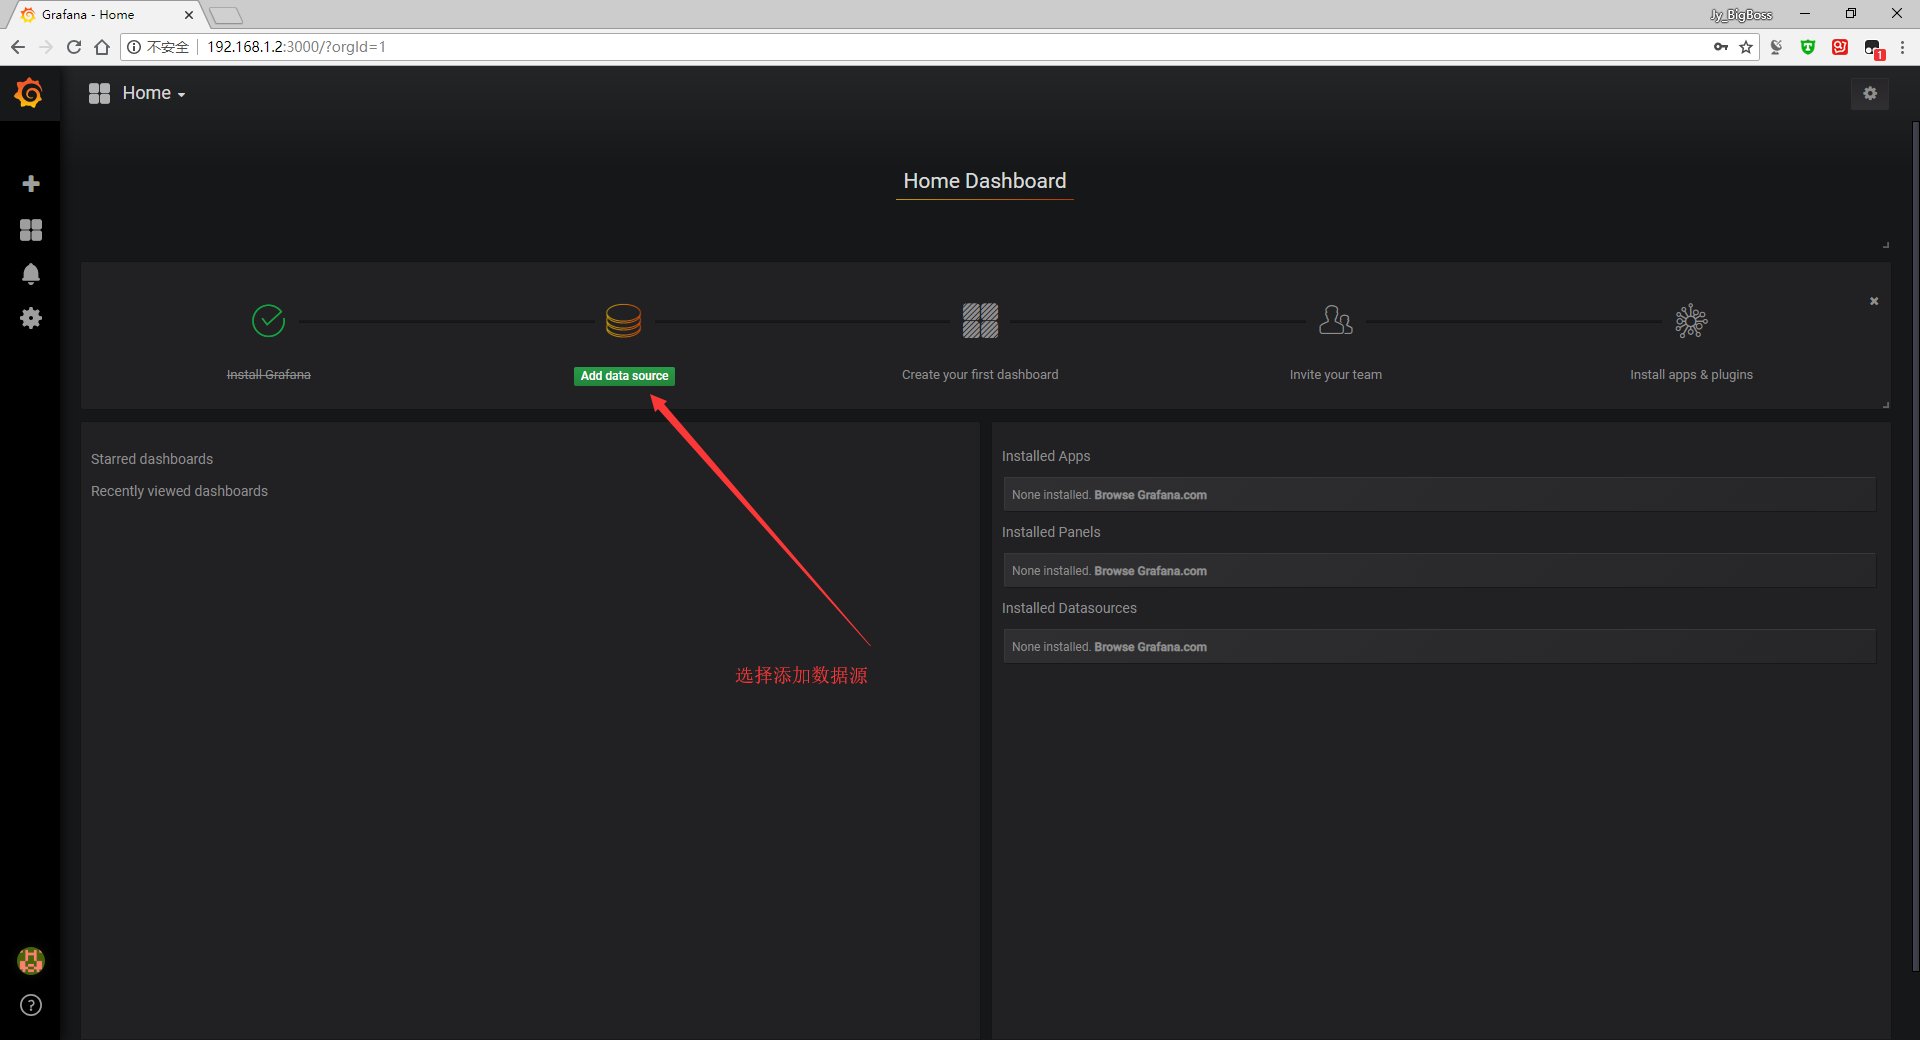
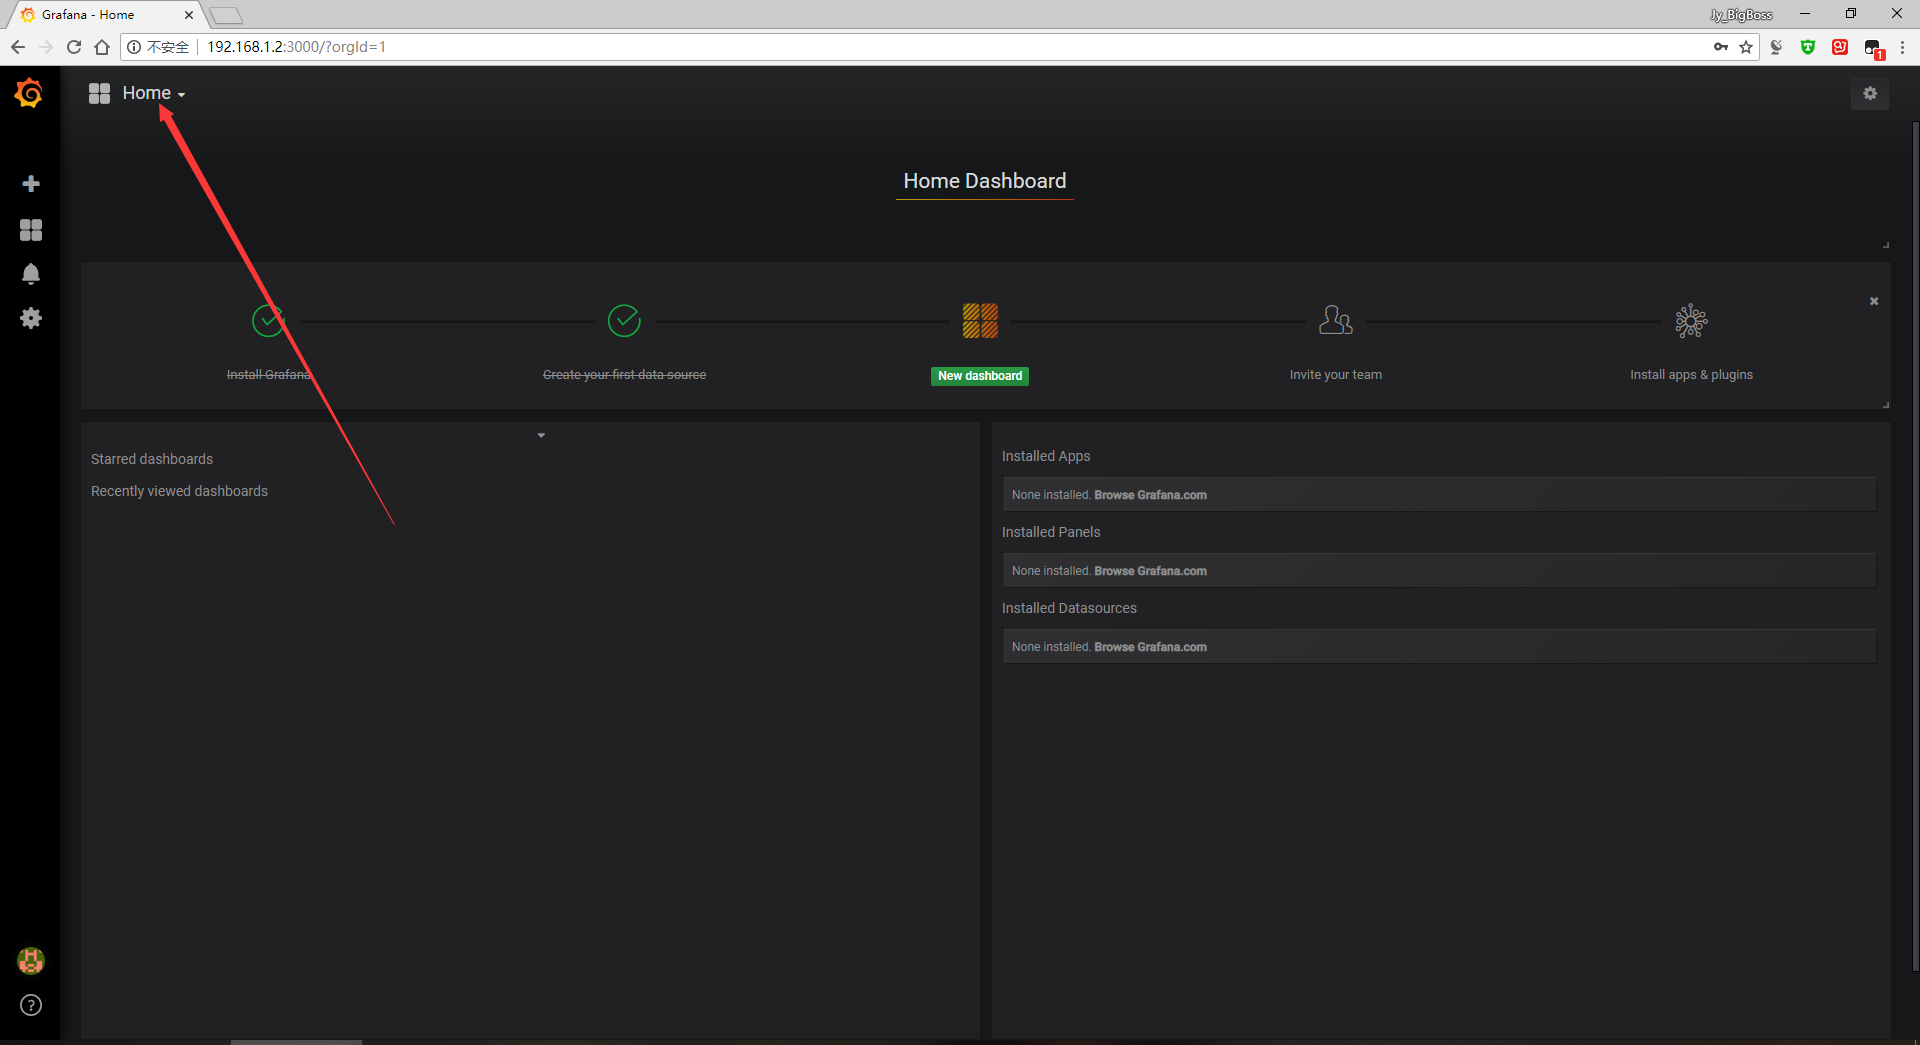
#開始配置儀表盤
#源碼倉庫中:pgwatch2/grafana_dashboards/v5/路徑下就是所有的儀表盤內容,每個文件夾爲一個儀表盤
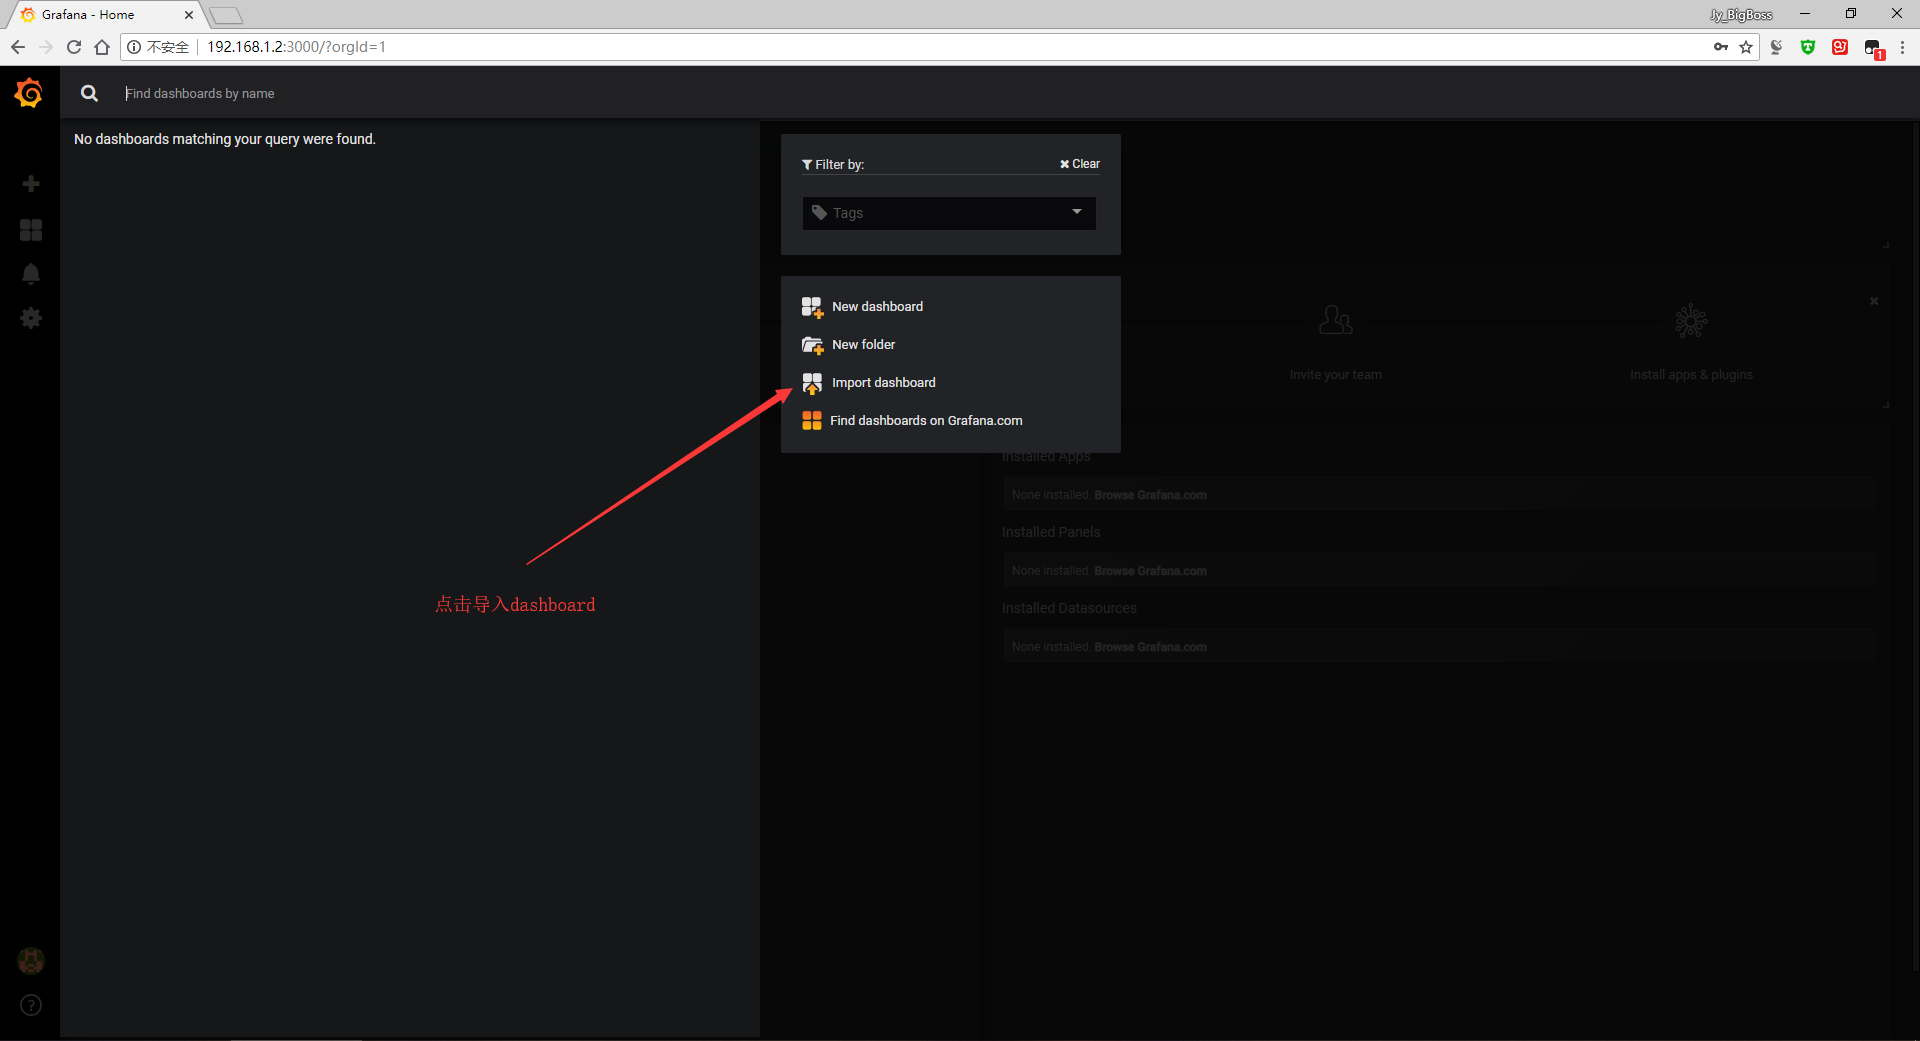
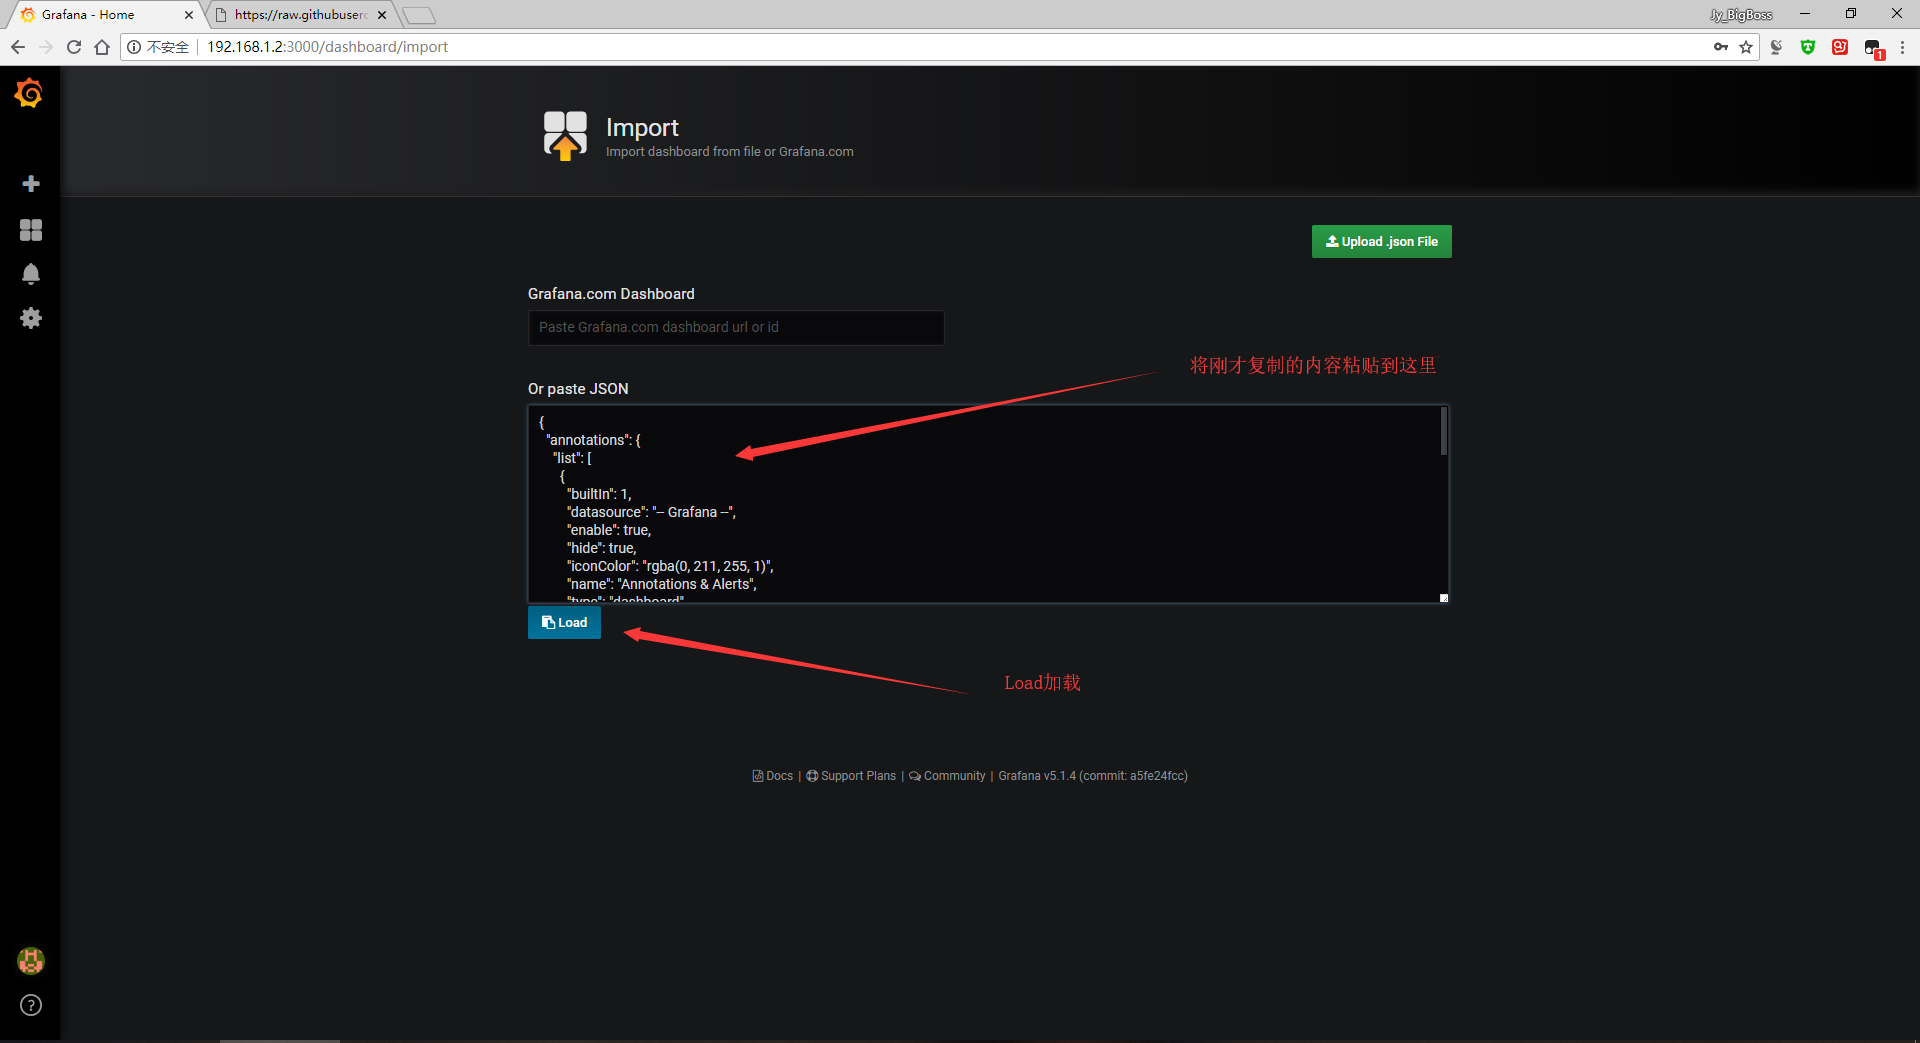
#每個文件夾內都含有dashboard.json文件,把這個文件導入即可
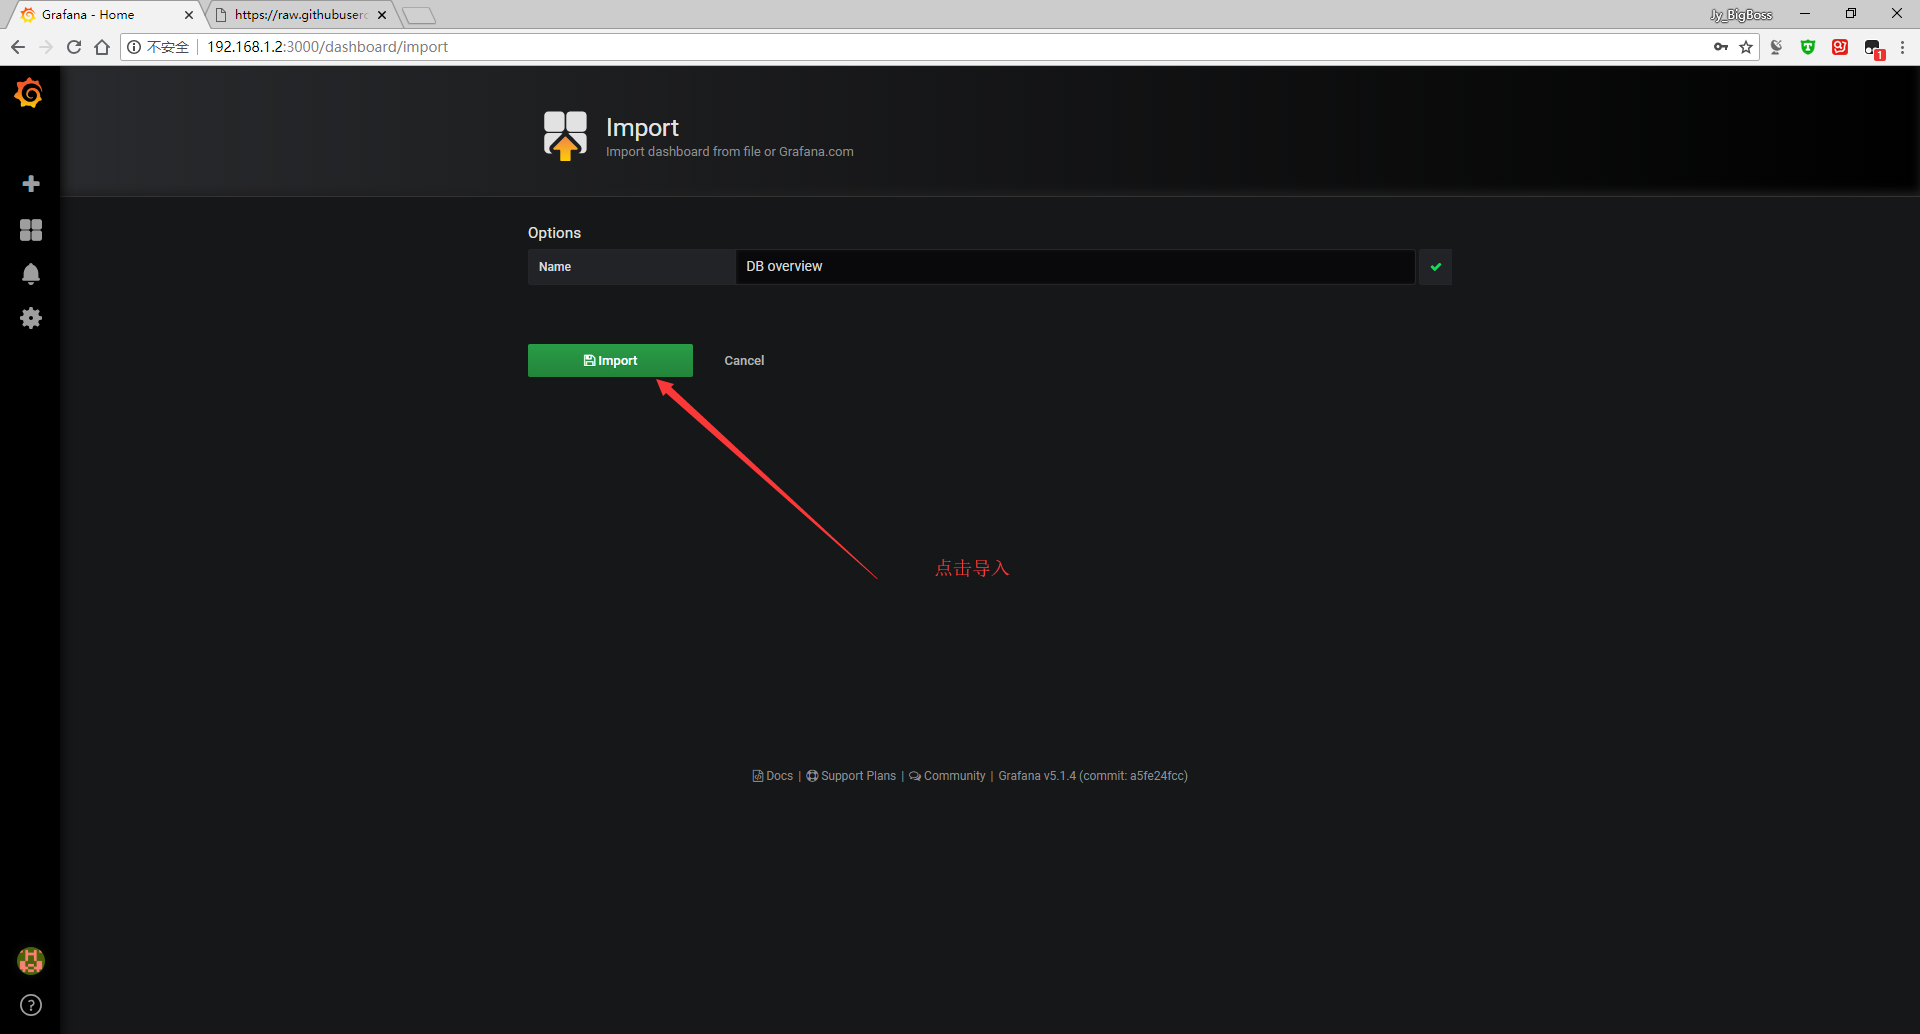
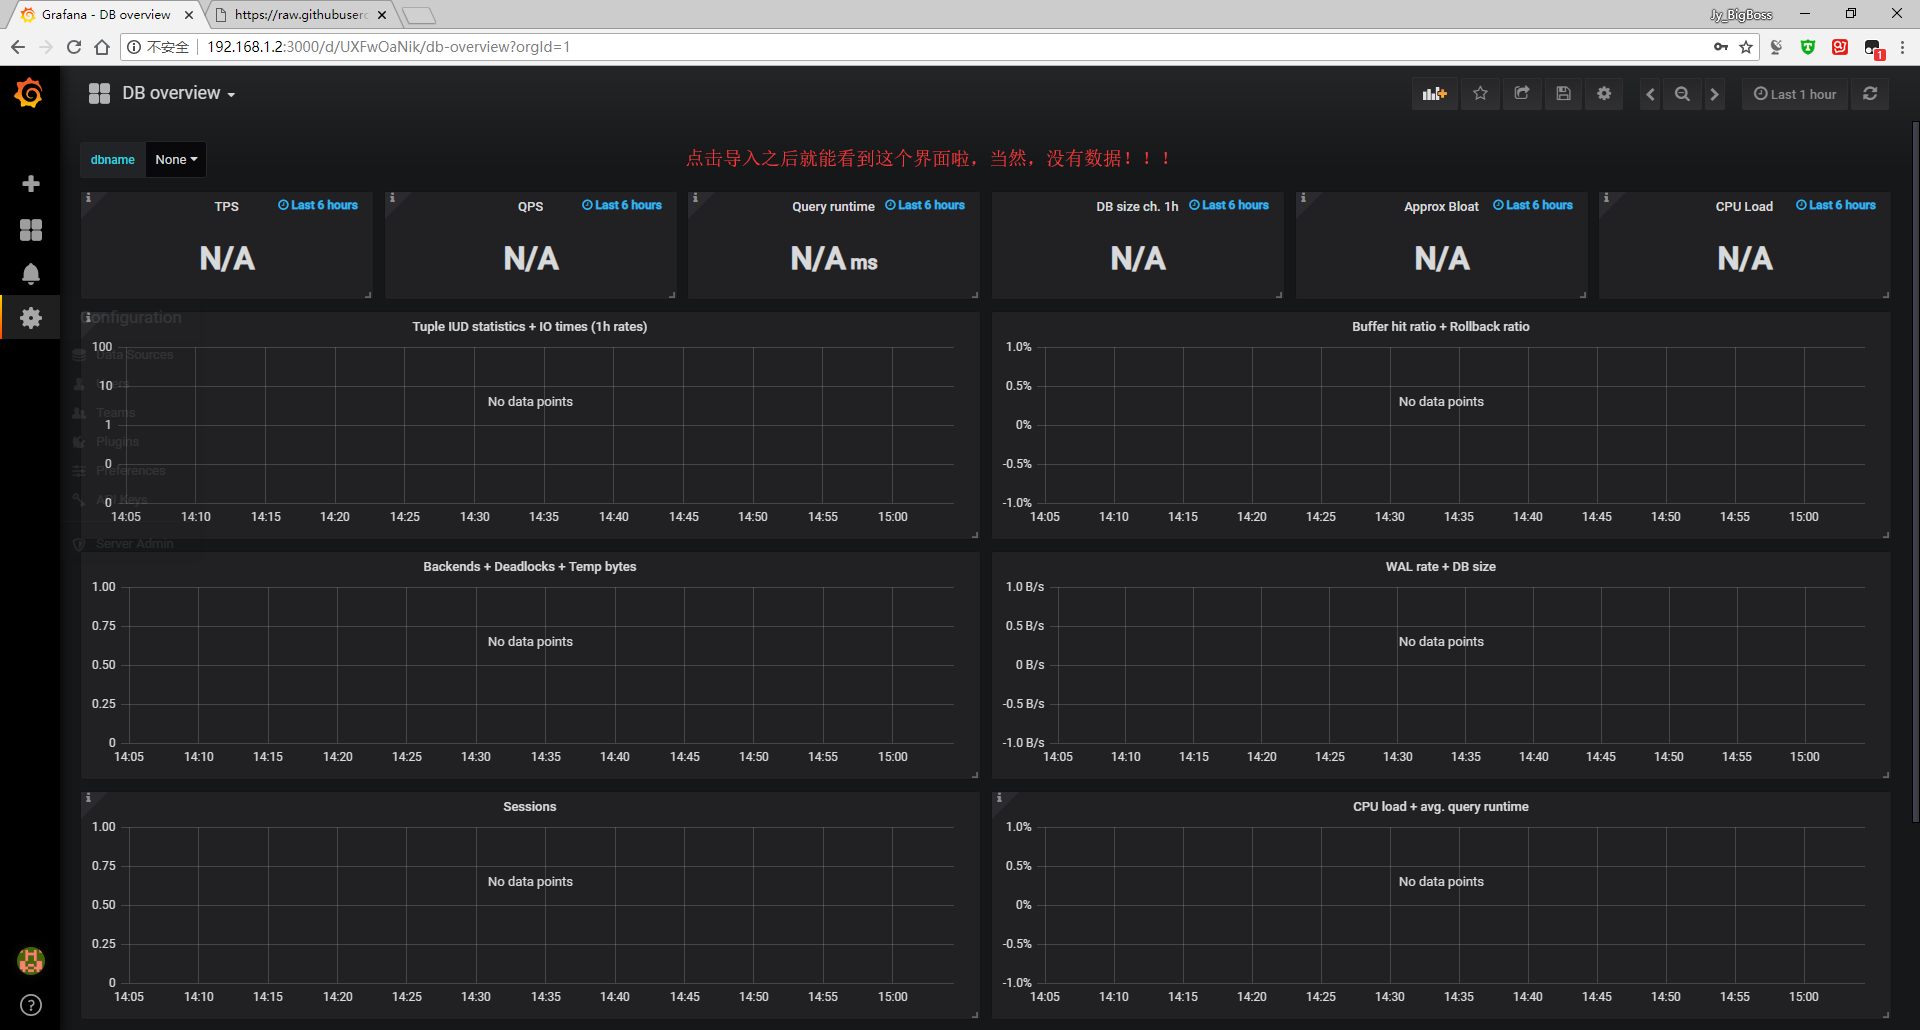
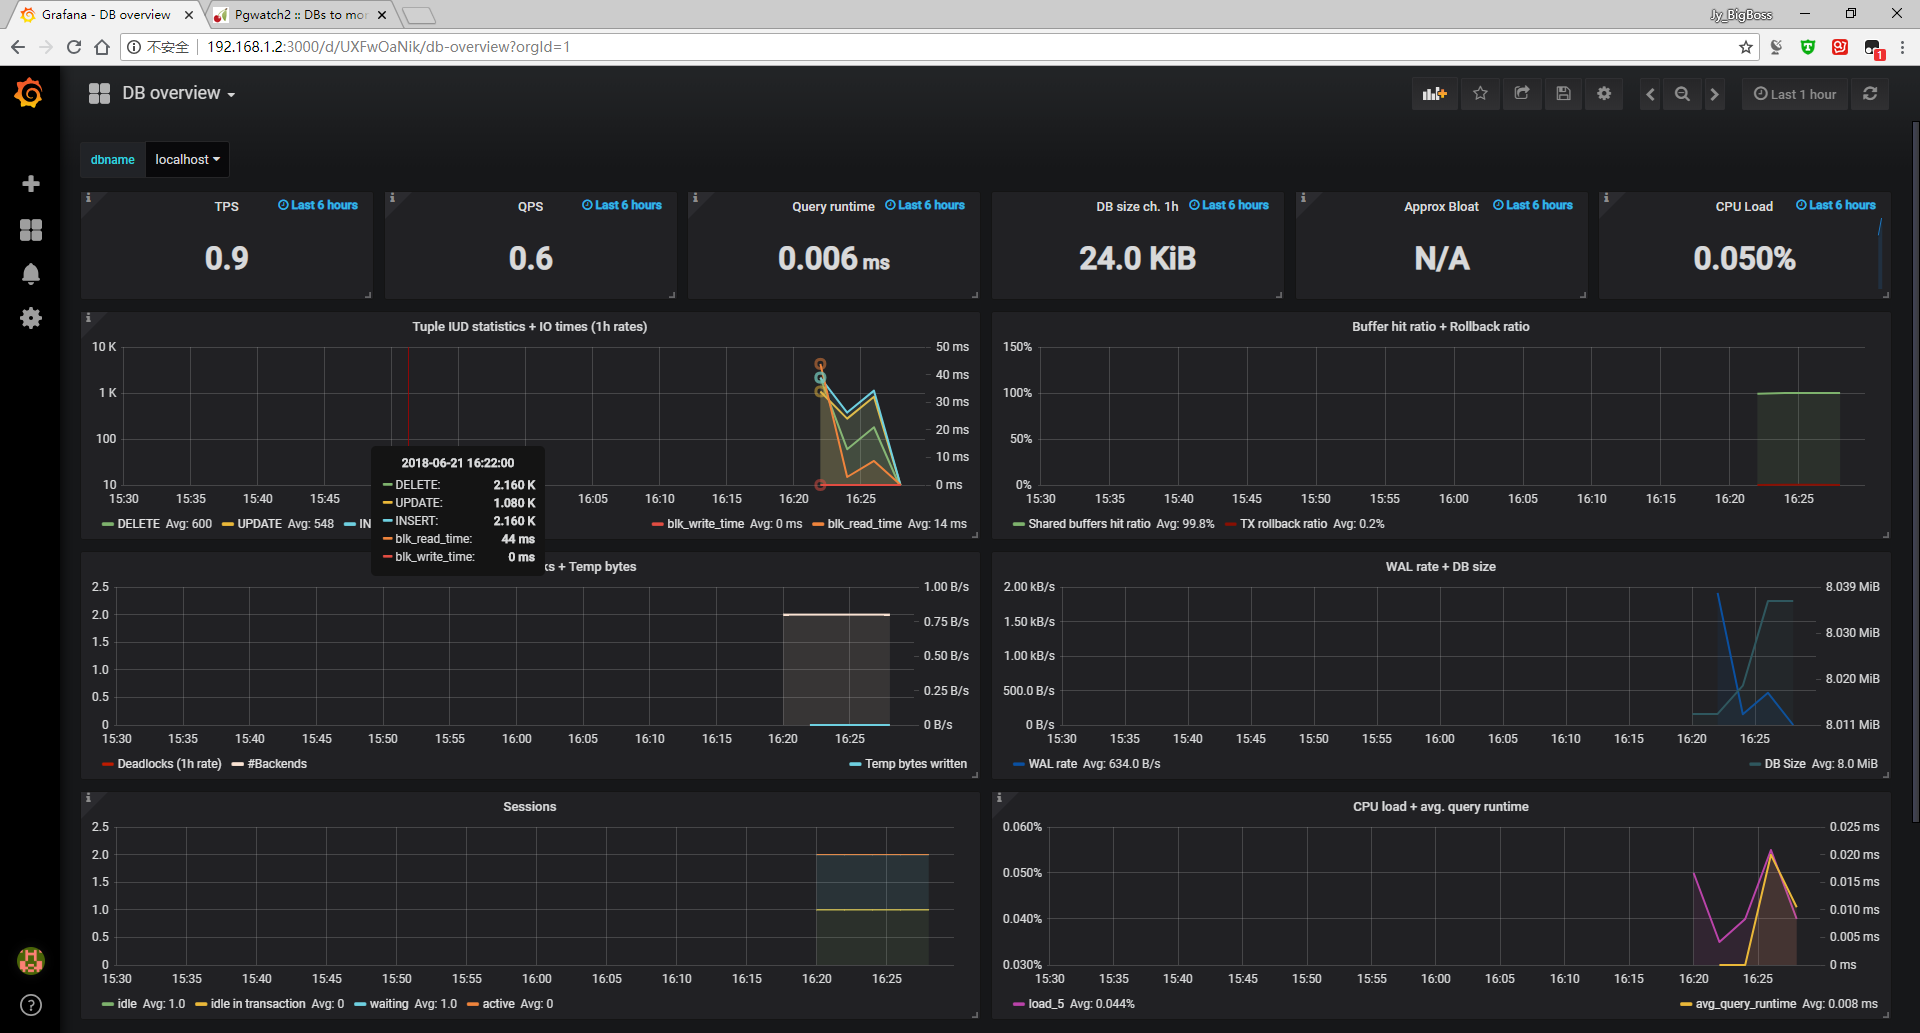
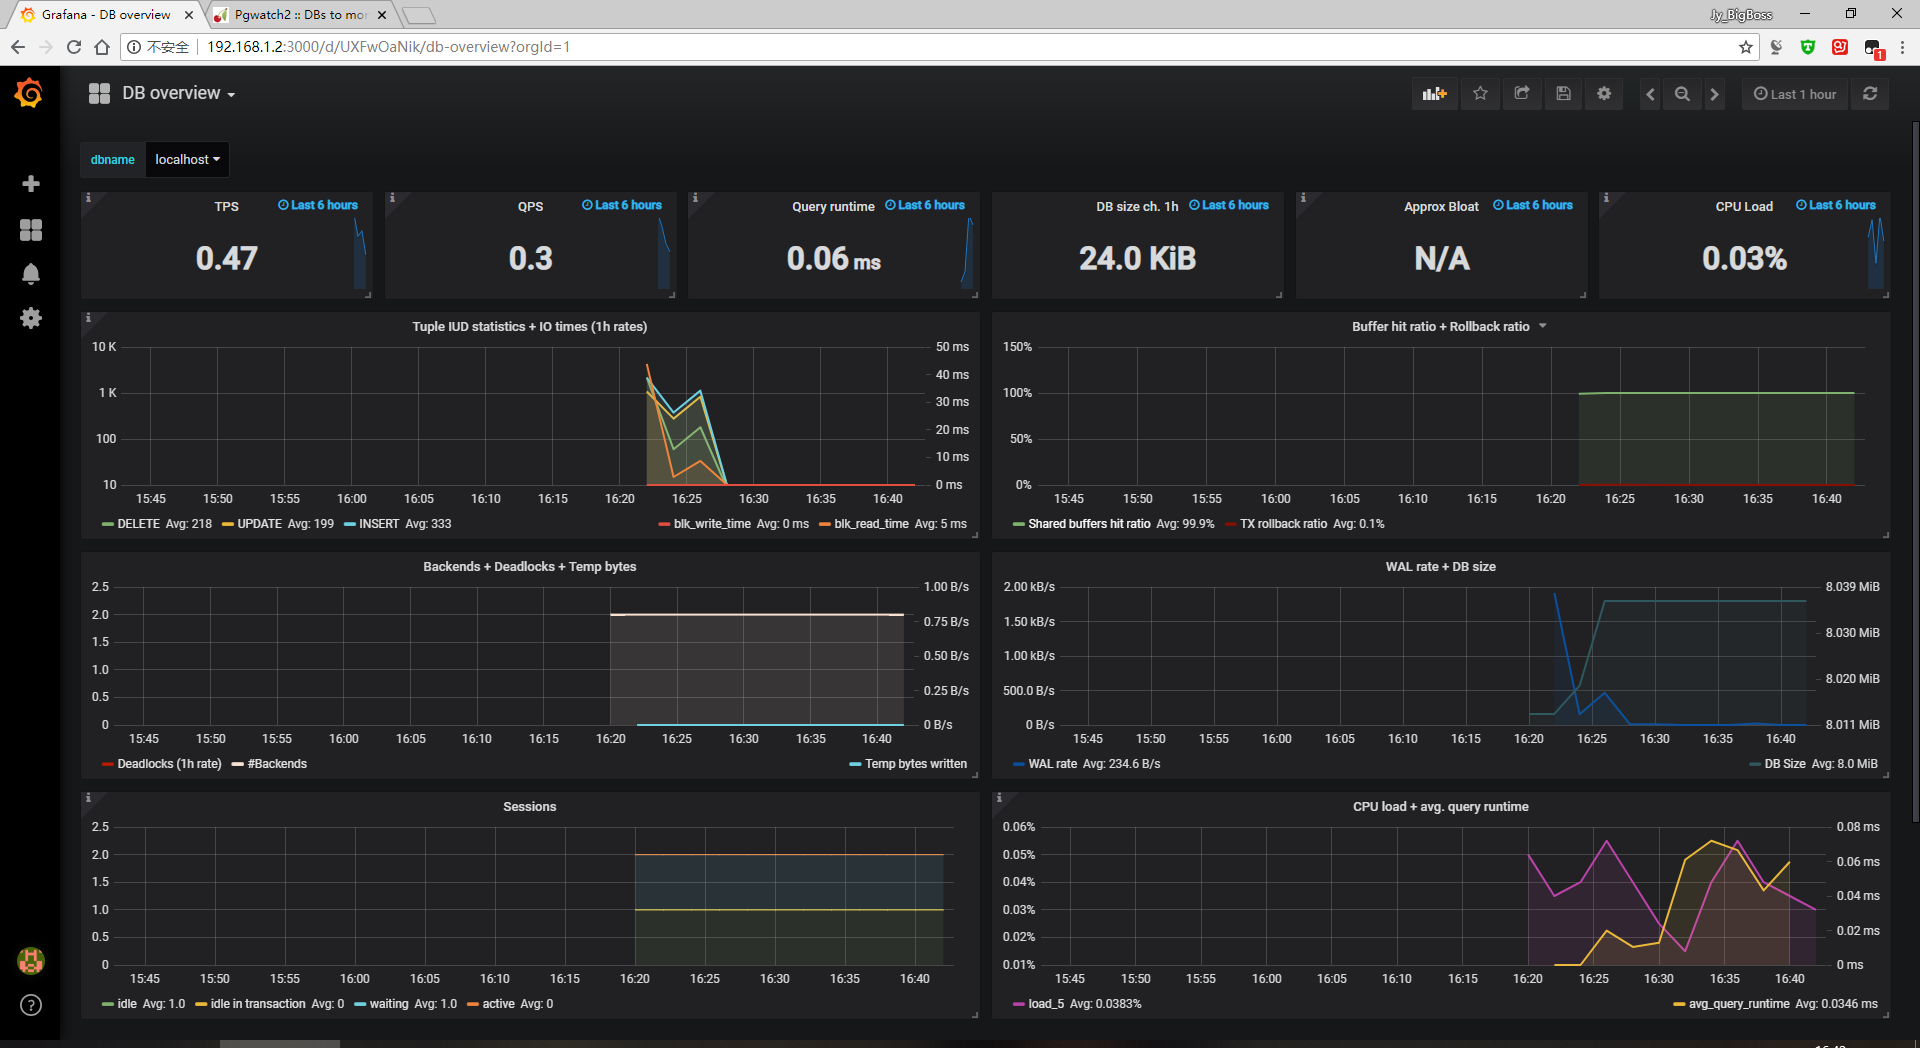
#這裏爲了展示效果我就只導入一個:db-overview/dashboard.json
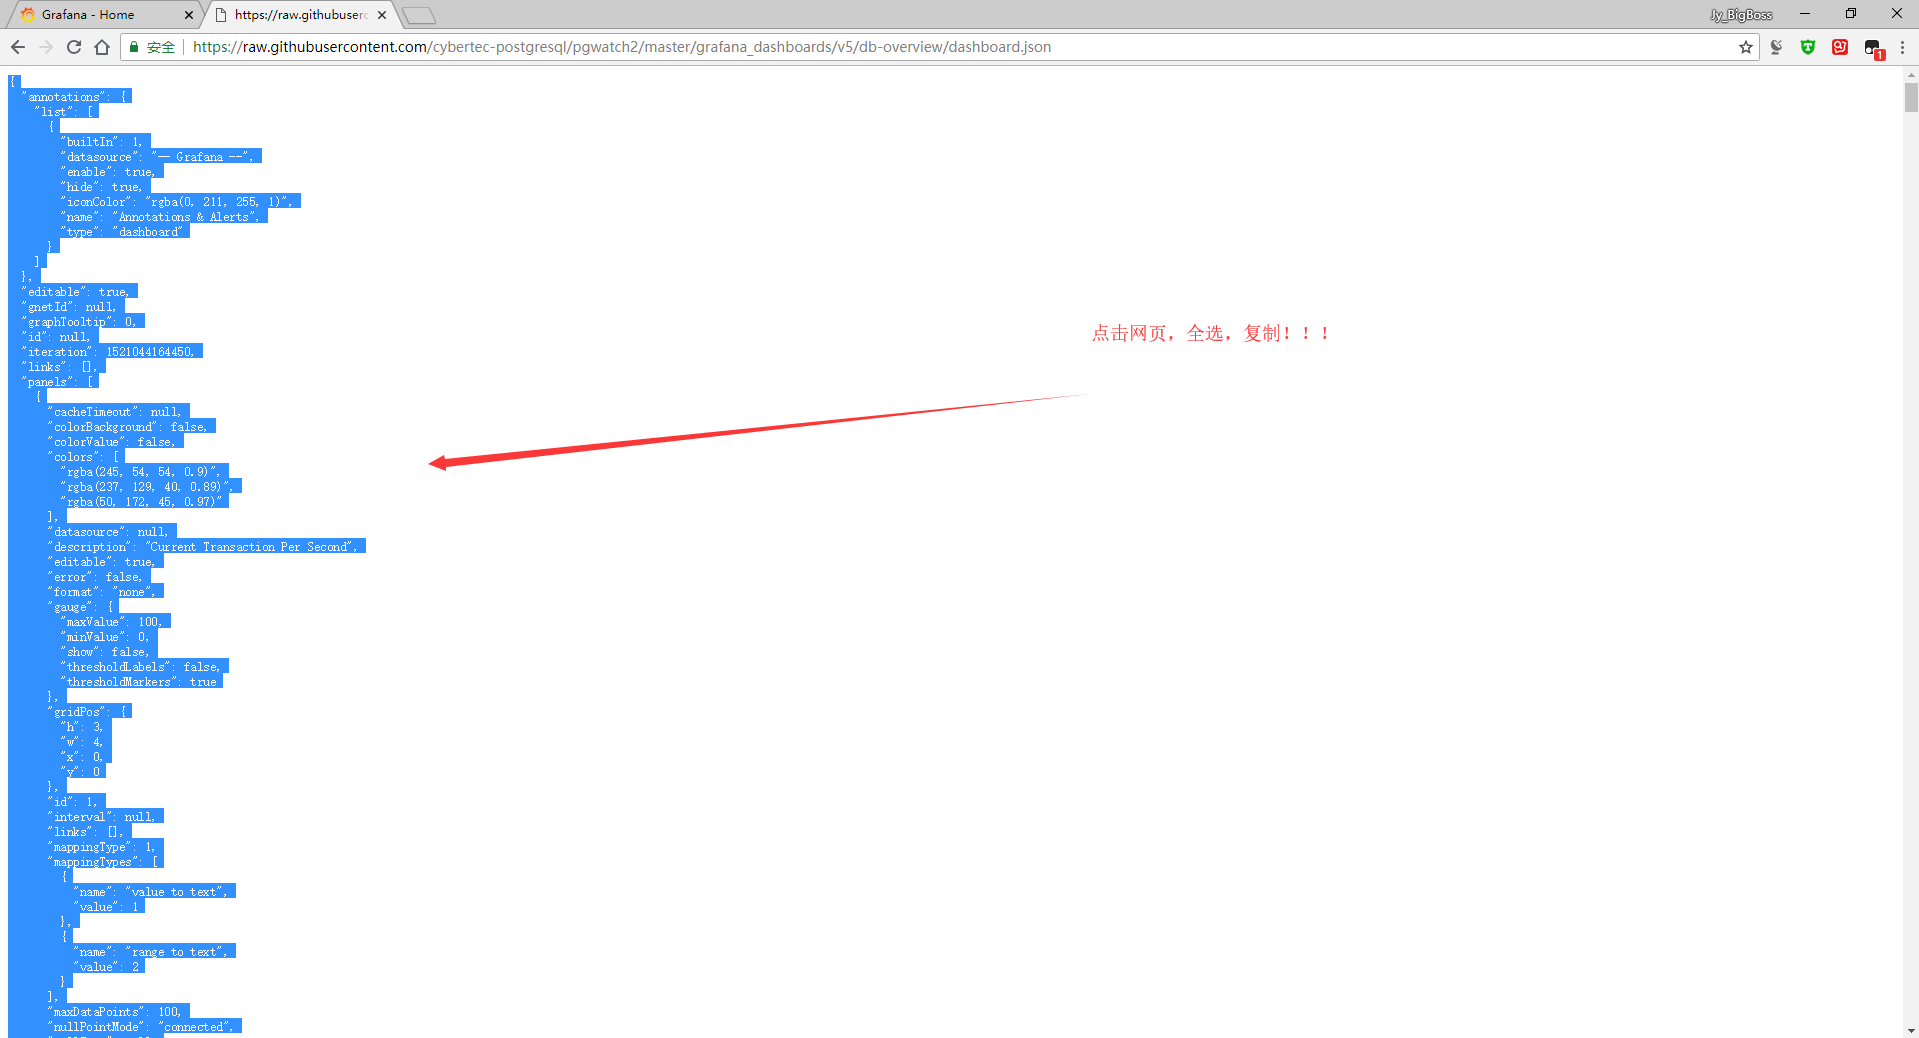
#github網頁上的會比較好複製,複製網頁中的所有內容:
#https://raw.githubusercontent.com/cybertec-postgresql/pgwatch2/master/grafana_dashboards/v5/db-overview/dashboard.json
四、配置pgwatch2
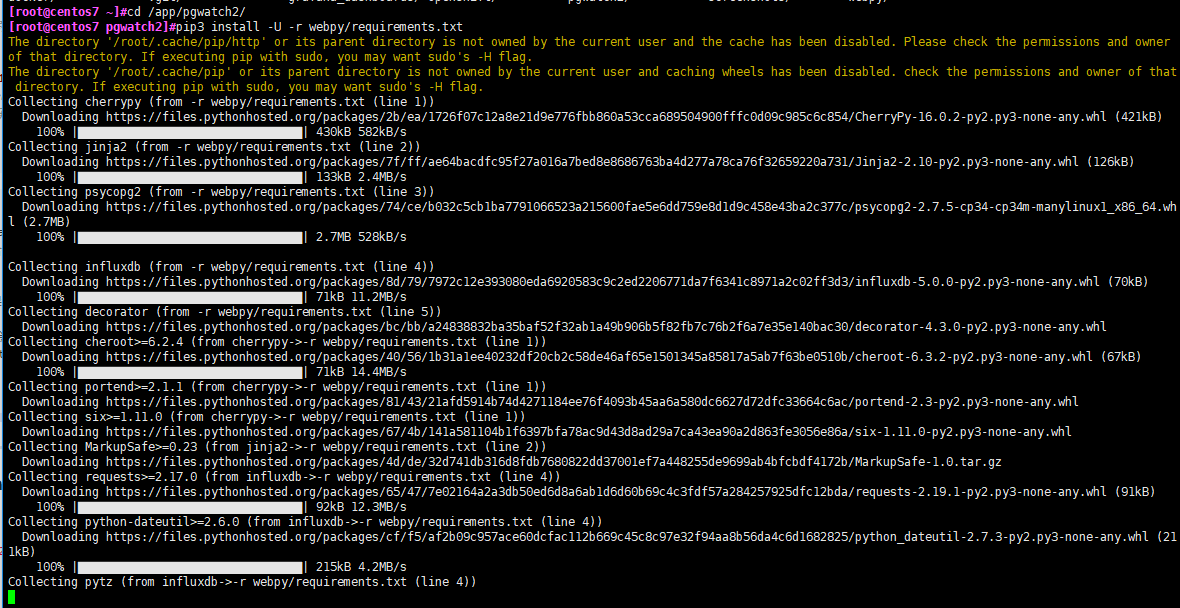
cd /app/pgwatch2/
pip3 install -U -r webpy/requirements.txt
cd webpy
python3 web.py

#進入pgwatch目錄,pip安裝一些依賴庫
#執行web.py
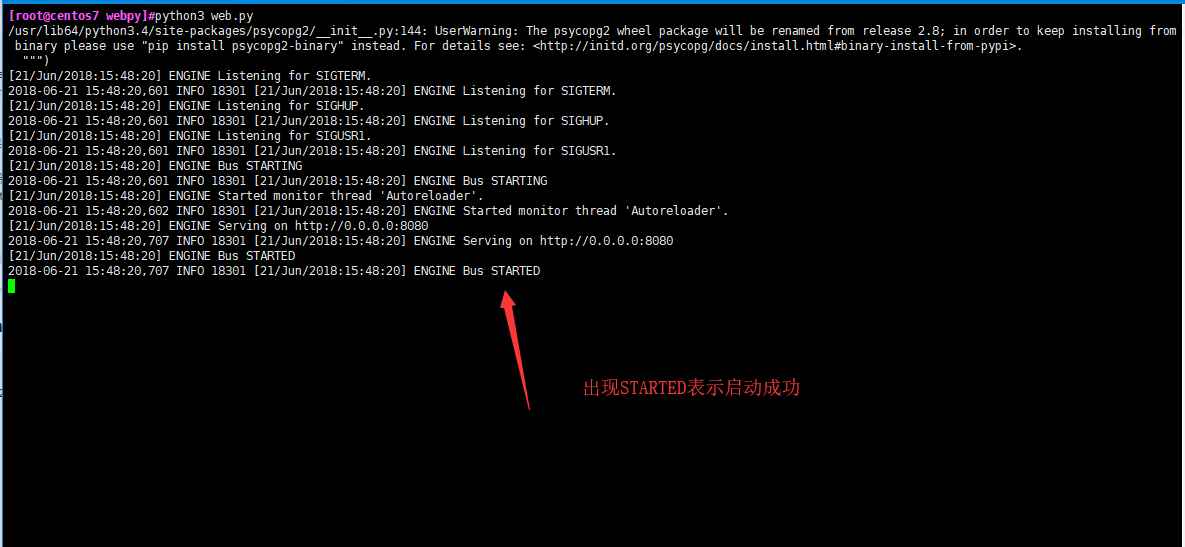
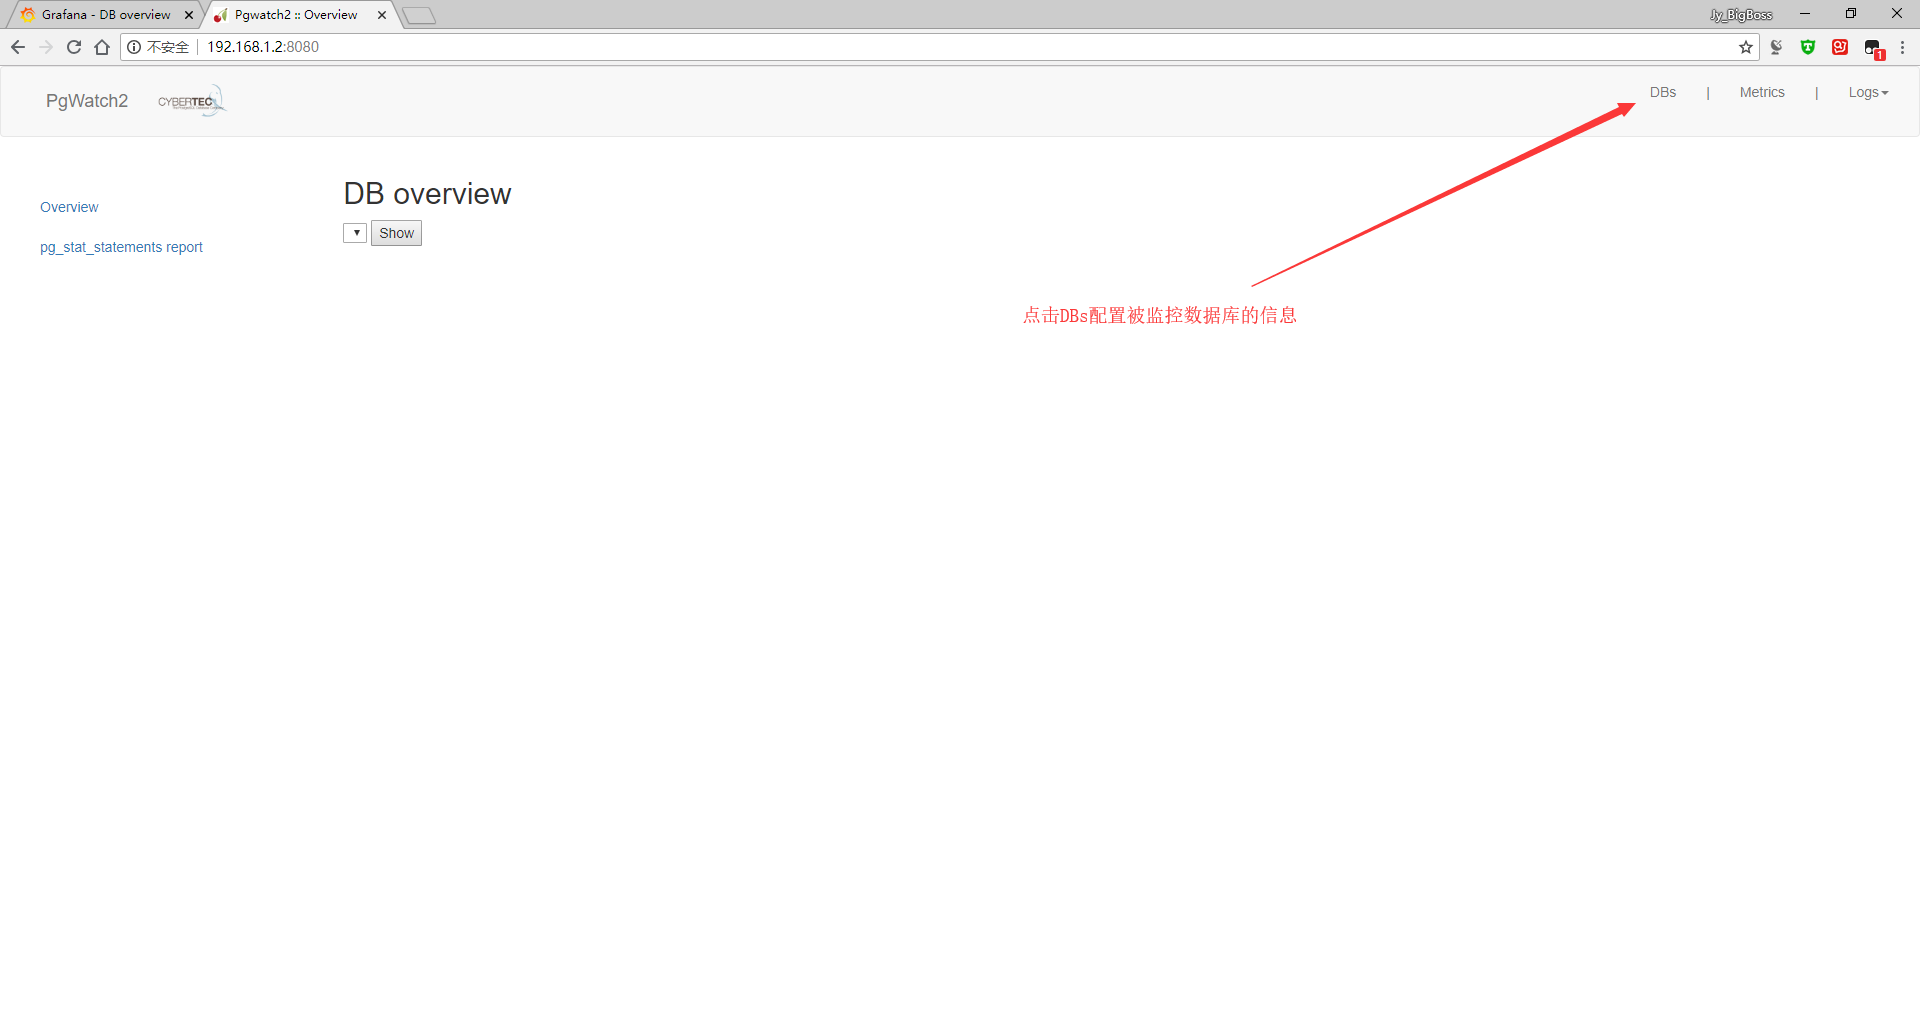
#訪問web頁面進行下一步配置
#配置被監控數據庫的信息,注意,這裏填的是被監控數據庫的信息!!!
#也就是你要在對應的數據庫創建用戶並且授權,然後啓用pg_stat_statements模塊
#我這裏僅僅只監控本機上的pgwatch2數據庫。
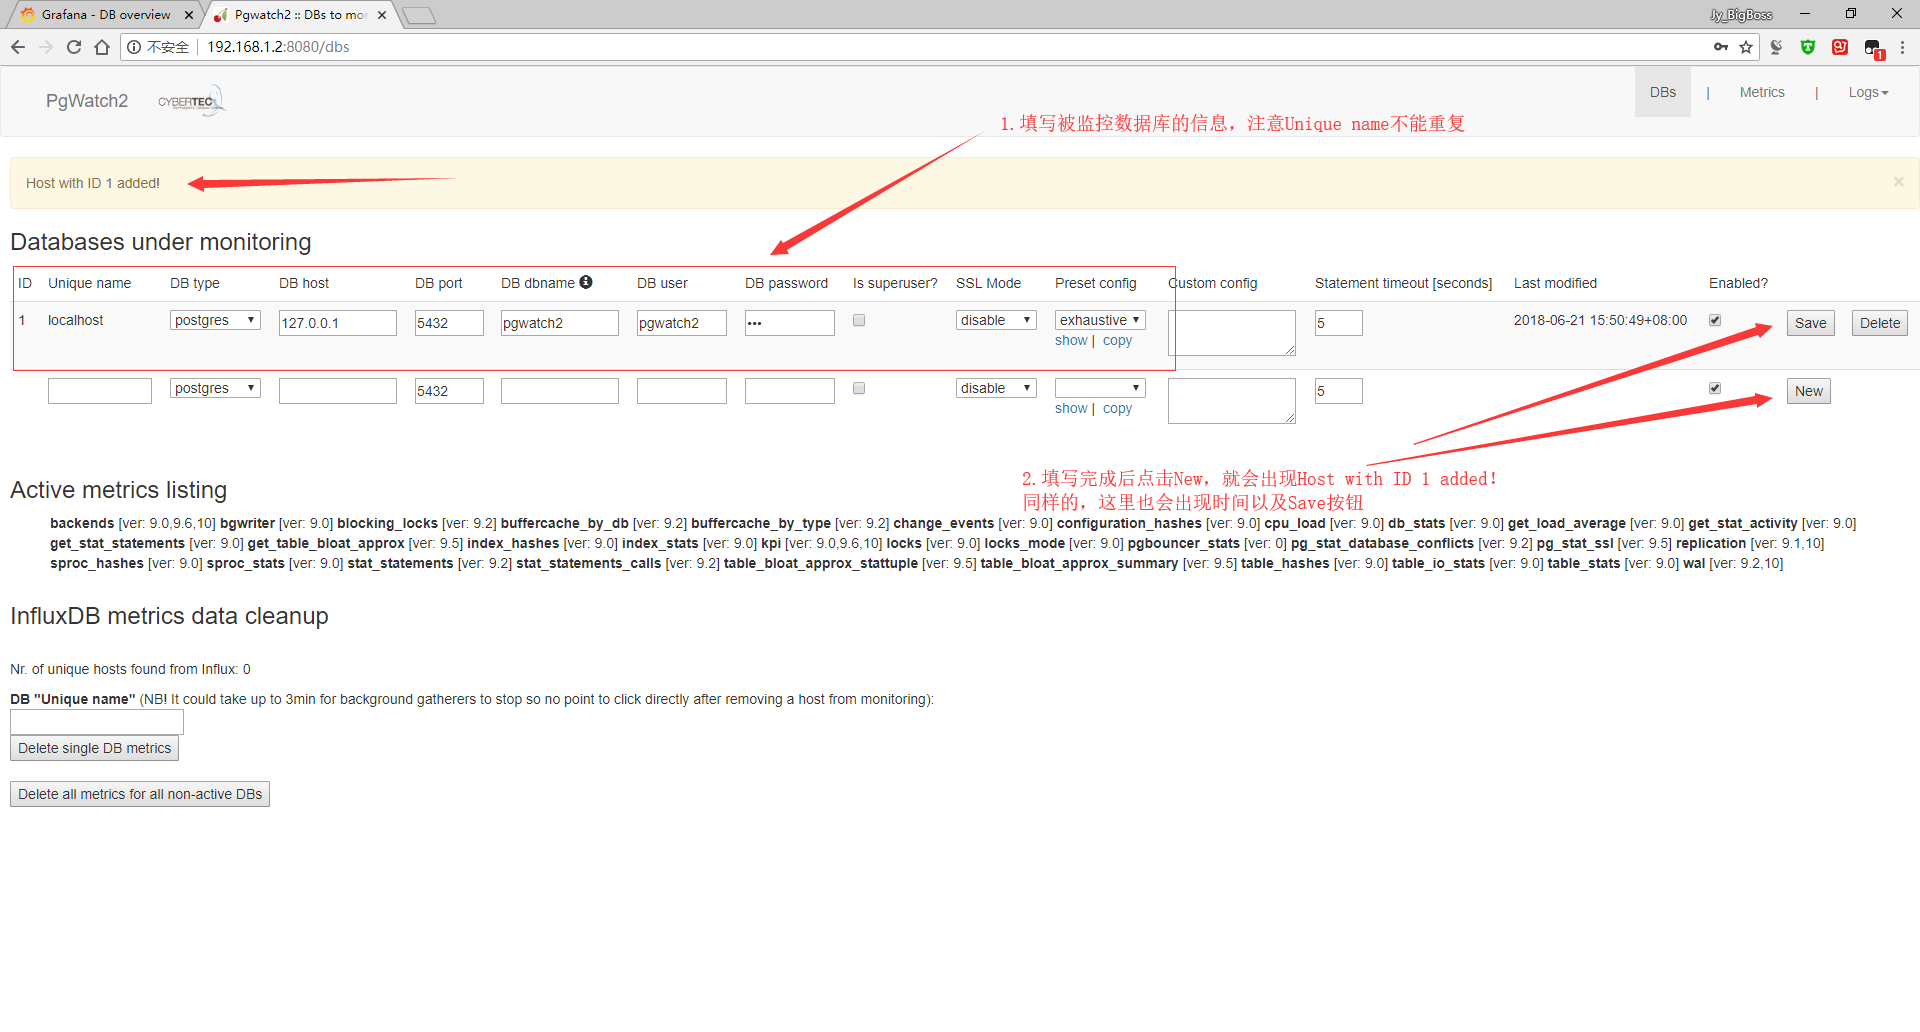
#配置被監控的數據庫
#這裏我就只監控pgwatch2數據庫
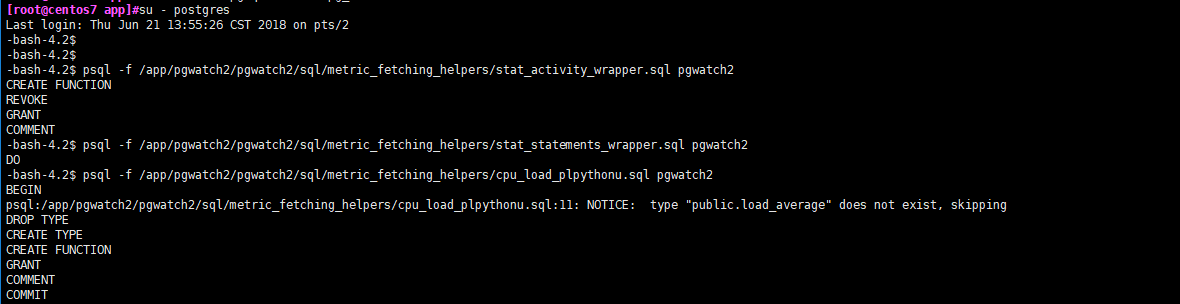
su - postgres
psql -d pgwatch2 -c "CREATE EXTENSION pg_stat_statements;"
psql -d pgwatch2 -c "CREATE EXTENSION plpythonu;"
psql -f /app/pgwatch2/pgwatch2/sql/metric_fetching_helpers/stat_activity_wrapper.sql pgwatch2
psql -f /app/pgwatch2/pgwatch2/sql/metric_fetching_helpers/stat_statements_wrapper.sql pgwatch2
psql -f /app/pgwatch2/pgwatch2/sql/metric_fetching_helpers/cpu_load_plpythonu.sql pgwatch2
psql -f /app/pgwatch2/pgwatch2/sql/metric_fetching_helpers/table_bloat_approx.sql pgwatch2
#官方說明:https://github.com/cybertec-postgresql/pgwatch2#steps-to-configure-your-database-for-monitoring
#編譯pgwatch2程序
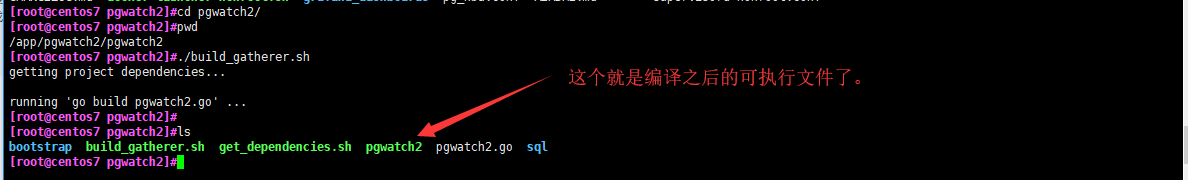
yum install go -y
cd /app/pgwatch2/pgwatch2
./build_gatherer.sh
#安裝go語言環境,進入pgwatch2目錄,執行build_gatherer.sh開始編譯
#這個過程會比較慢,因爲會到github上下載東西,一定要保證電腦可以ping通github
#編譯完成後會生成一個pgwatch2的可執行文件
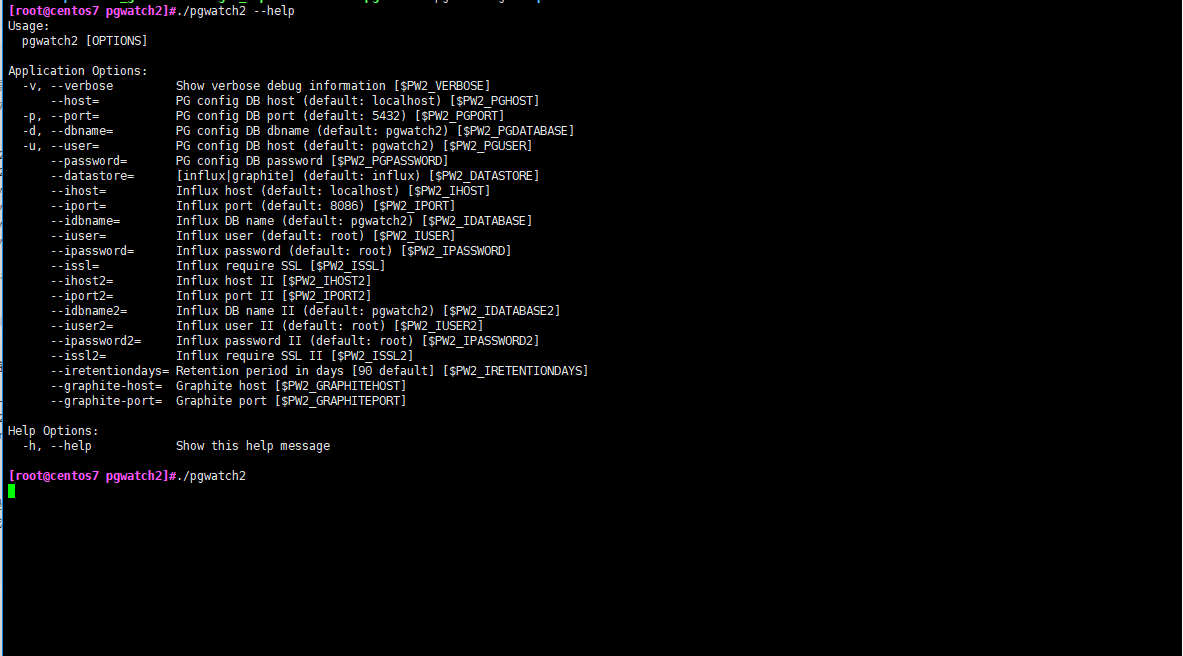
./pgwatch2

#運行pgwatch2程序
#因爲剛纔設置的所有賬戶密碼跟pgwatch2程序默認值是一致的,所有直接運行即可
#若不一致,請自行使用./pgwatch2 --help查看幫助

#執行不報錯,接下來去Grafana看數據就行了!!!
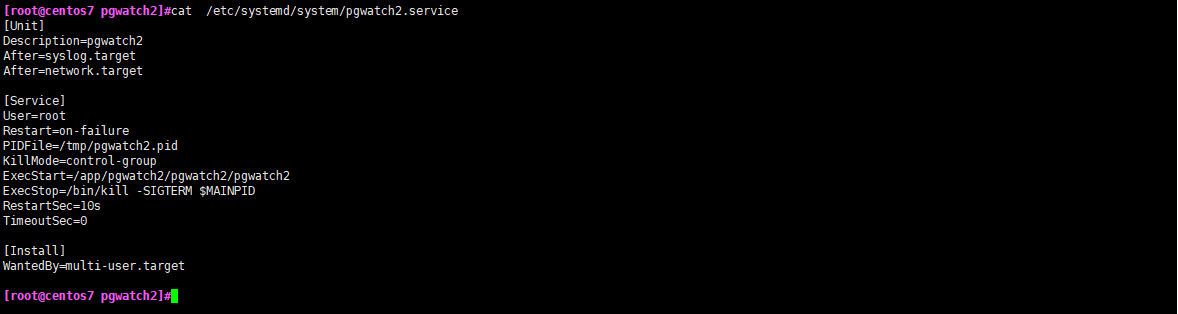
#最後,把pgwatch2配置成可以用systemctl方式啓動
#把下面的內容粘貼到/etc/systemd/system/pgwatch2.service
#然後就可以用systemctl start 啓動啦
#注意,通過這個方式啓動,所有的輸出信息都會在/var/log/messages

[Unit]
Description=pgwatch2
After=syslog.target
After=network.target

[Service]
User=root
Restart=on-failure
PIDFile=/tmp/pgwatch2.pid
KillMode=control-group
ExecStart=/app/pgwatch2/pgwatch2/pgwatch2
ExecStop=/bin/kill -SIGTERM $MAINPID
RestartSec=10s
TimeoutSec=0

[Install]
WantedBy=multi-user.target