


有些已經在Unity裏使用優化掉了。
C# MEMORY AND PERFORMANCE TIPS FOR UNITY
There’s a lot of useful information out there about memory and performance optimizations in Unity. I have myself relied heavily on Wendelin Reich’s postsand Andrew Fray’s list when getting started – they are excellent resources worth studying.
I’m hoping this post will add some a few more interesting details, collected from various sources as well as from my own optimization adventures, about ways to improve performance using this engine.
The following specifically concentrates on perf improvements on the coding side, such as looking at different code constructs and see how they perform in both speed and memory usage. (There is another set of perf improvements that are also useful, such as optimizing your assets, compressing textures, or sharing materials, but I won’t touch those here. Good idea for another post, though!)
First, let’s start with a quick recap about memory allocation and garbage collection.
Always on my mind
One of the first things gamedevs always learn is to not allocate memory needlessly. There are very good reasons for that. First, it’s a limited resource, especially on mobile devices. Second, allocation is not free – allocating and deallocating on the heap will cost you CPU cycles. Third, in languages with manual memory management like C or C++, each allocation is an opportunity to introduce subtle bugs that can turn into huge problems, anywhere from memory leaks to full crashes.
Unity uses .NET, or rather its open source cousin, Mono. It features automatic memory management which fixes a lot of the safety problems, for example it’s no longer possible to use memory after it has been deallocated (ignoring unsafe code for now). But it makes the cost of allocation and deallocation even harder to predict.
I assume you’re already familiar with the distinction between stack allocation and heap allocation, but in short: data on the stack is short-lived, but alloc/dealloc is practically free, while data on the heap can live as long as necessary, but alloc/dealloc becomes more expensive as the memory manager needs to keep track of allocations. In .NET and Mono specifically, heap memory gets reclaimed automatically by the garbage collector (GC), which is practically speaking a black box, and the user doesn’t have a lot of control over it.
.NET also exposes two families of data types, which get allocated differently. Instances of reference types such as classes, or arrays such as int[], always get allocated on the heap, to be GC’d later. Data of value type, such as primitives (int, string, etc) or instances of structs, can live on the stack, unless they’re inside a container that already lives on the heap (such as an array of structs). Finally, value types can be promoted from the stack to the heap via boxing.
OK, enough setup. Let’s talk a bit about garbage collection and Mono.
It’s a sin
Finding and reclaiming data on the heap that’s no longer in use is the job of the GC, and different collectors can vary drastically in performance.
Older garbage collectors have gained a reputation for introducing framerate “hiccups”. For example, a simple mark-and-sweep collector is a blocking collector – it would pause the entire program so that it can process the entire heap at once. The length of the pause depends on the amount of data allocated by the program, and if this pause is long enough, it could result in noticeable stutter.
Newer garbage collectors have different ways for reducing those collection pauses. For example, so-called generational GCs split their work into smaller chunks, by grouping all recent allocations in one place so they can be scanned and collected quickly. Since many programs like to allocate temporary objects that get used and thrown away quickly, keeping them together helps make the GC more responsive.
Unfortunately Unity doesn’t do that. The version of Mono used by Unity is 2.6.5, and it uses an older Boehm GC, which is not generational and, I believe, not multithreaded. There are more recent versions of Mono with a better garbage collector, however, Unity has stated that the version of Mono will not be upgraded. Instead they’re working on a long-term plan to replace it with a different approach.
While this sounds like an exciting future, for now it means we have to put up with Mono 2.x and its old GC for a while longer.
In other words, we need to minimize memory allocations.
Opportunities
One of the first things that everyone recommends is to replace foreach loops with for loops when working with flat arrays. This is really surprising – foreachloops make code so much more readable, why would we want to get rid of them?
The reason is that a foreach loop internally creates a new enumerator instance. In pseudocode, a foreach loop like this:
foreach (var element in collection) { ... }
gets compiled to something like this:
var enumerator = collection.GetEnumerator();
while (enumerator.MoveNext()) {
var element = enumerator.Current;
// the body of the foreach loop
}
This has a few consequences:
- Using an enumerator means extra function calls to iterate over the collection
- Also: due to a bug in the Mono C# compiler that ships with Unity, the enumerator creates a throwaway object on the heap that GC will have to clean up later.
- The compiler doesn’t try to auto-optimize foreach loops into for loops, even for simple List collections – except for one special-case optimizationin Mono that turns foreach over arrays (but not over Lists) into for loops.
Let’s compare various for and foreach loops over a List<int> or an int[] of 16M elements, adding up all the elements. And let’s throw in a Linq extension in there too.
(The following measurements are taken using Unity’s own performance profiler, using a standalone build under Unity 5.0.1, on an Intel i7 desktop machine. Yes, I’m aware of the limitations of synthetic benchmarks – use these as rough guidelines, always profile your own production code, etc.)
Right, back to the post…
// const SIZE = 16 * 1024 * 1024;
// array is an int[]
// list is a List<int>
1a. for (int i = 0; i < SIZE; i++) { x += array[i]; }
1b. for (int i = 0; i < SIZE; i++) { x += list[i]; }
2a. foreach (int val in array) { x += val; }
2b. foreach (int val in list) { x += val; }
3. x = list.Sum(); // linq extension
time memory
1a. for loop over array .... 35 ms .... 0 B
1b. for loop over list ..... 62 ms .... 0 B
2a. foreach over array ..... 35 ms .... 0 B
2b. foreach over list ..... 120 ms ... 24 B
3. linq sum() ............ 271 ms ... 24 B
Clearly, a for loop over an array is the winner (along with foreach over arrays thanks to the special case optimization).
But why is a for loop over a list considerably slower than over an array? Turns out, it’s because accessing a List element requires a function call, so it’s slower than array access. If we look at the IL code for those loops, using a tool like ILSpy, we can see that “x += list[i]” really gets turned into a function call like “x += list.get_Item(i)“.
It gets even slower with Linq Sum() extension. Looking at the IL, the body of Sum() is essentially a foreach loop that looks like “tmp = enum.get_Current(); x = fn.Invoke(x, tmp)” where fn is a delegate to an adder function. No wonder it’s much slower than the for loop version.
Let’s try something else, this time the same number of elements only arranged in a 2D array, of 4K arrays or lists each 4K elements long, using nested forloops vs nested foreach loops:
time memory
1a. for loops over array[][] ...... 35 ms ..... 0 B
1b. for loops over list<list<int>> . 60 ms ..... 0 B
2a. foreach on array[][] ........... 35 ms ..... 0 B
2b. foreach on list<list<int>> .... 120 ms .... 96 KB <-- !
No big surprises there, the numbers are on par with the previous run, but it highlights how much memory gets wasted with nested foreach loops: (1 + 4026) x 24 bytes each ~= 96 KB. Imagine if you’re doing nested loops on each frame!
In the end: in tight loops, or when looping over large collections, arrays perform better than generic collections, and for loops better than foreach loops.We can get a huge perf improvement by downgrading to arrays, not to mention save on mallocs.
Outside of tight loops and large collections, this doesn’t matter so much (and foreach and generic collections make life so much simpler).
What have I done to deserve this
Once we start looking, we can find memory allocations in all sorts of odd places.
For instance, calling functions with a variable number of arguments actually allocates those args on the heap in a temporary array (which is an unpleasant surprise to those coming from a C background). Let’s look at doing a loop of 256K math max operations:
1. Math.Max(a, b) ......... 0.6 ms ..... 0 B
2. Mathf.Max(a, b) ........ 1.1 ms ..... 0 B
3. Mathf.Max(a, b, b) ...... 25 ms ... 9.0 MB <-- !!!
Calling Max with three arguments means invoking a variadic “Mathf.Max(params int[] args)“, which then allocates 36 bytes on the heap for each function call (36B * 256K = 9MB).
For another example, let’s look at delegates. They’re very useful for decoupling and abstraction, but there’s one unexpected behavior: assigning a delegate to a local variable also appears to box it. We get a spurious heap allocation even if we’re just storing the delegate in a temporary local variable.
Here’s an example of 256K function calls in a tight loop:
protected static int Fn () { return 1; }
1. for (...) { result += Fn(); }
2. Func fn = Fn; for (...) { result += fn.Invoke(); }
3. for (...) { Func fn = Fn; result += fn.Invoke(); }
1. Static function call ....... 0.1 ms .... 0 B
2. Assign once, invoke many ... 1.0 ms ... 52 B
3. Assign many, invoke many .... 40 ms ... 13 MB <-- !!!
Looking at IL in ILSpy, every single local variable assignment like “Func<int> fn = Fn” creates a new instance of the delegate class Func<int32> on the heap, taking up 52 bytes that are then going to be thrown away immediately, and this compiler at least isn’t smart enough to hoist the invariant local variable out of the body of the loop.
Now this made me worry. What about things like lists or dictionaries of delegates – for example, when implementing the observer pattern, or a dictionary of handler functions? If we iterated over them to invoke each delegate, will this cause tons of spurious heap allocations?
Let’s try iterating and executing over a List<> of 256K delegates:
4. For loop over list of delegates .... 1.5 ms .... 0 B
5. Foreach over list of delegates ..... 3.0 ms ... 24 B
Whew. At least looping over a list of delegates doesn’t re-box them, and a peek at the IL confirms that.
Se a vida é
There are more random opportunities for minimizing memory allocation. In brief:
- Some places in the Unity API want the user to assign an array of structs to a property, for example on the Mesh component:
- void Update () {
- // new up Vector2[] and populate it
- Vector2[] uvs = MyHelperFunction();
- mesh.uvs = uvs;
- }
Unfortunately, as we mentioned before, a local array of value types gets allocated on the heap, even though Vector2 are value types and the array is just a local variable. If this runs on every frame, that’s 24B for each new array, plus the size of each element (in case of Vector2 it’s 8B per element).
There’s a fix that’s ugly but useful: keep a scratch list of the appropriate size and reuse it:
// assume a member variable initialized once:
// private Vector2[] tmp_uvs;
//
void Update () {
MyHelperFunction(tmp_uvs); // populate
mesh.uvs = tmp_uvs;
}
This works because Unity API property setters will silently make a copy of the array you pass in, and not hold on to the array reference (unlike what one might think). So there’s really no point in making scratch copies all the time.
- Because arrays are not resizable, it’s often more convenient to use List<> instances instead, and then add or remove elements as necessary, like this:
- List<int> ints = new List<int>();
- for (...) { ints.Add(something); }
As an implementation detail, when a List is allocated this way using the default constructor, it will start with a pretty small capacity (that is, it will only allocate internal storage for a small number of elements, such as four). Once that is exceeded, it will need to allocate a new larger chunk of memory (say, eight elements long), and move them over.
So if game code needs to create a list and add a large number of elements, it’s better to specify capacity explicitly like this, even overshooting a bit, to avoid unnecessary re-sizing and re-allocations:
List<int> ints = new List<int>(expectedSize);
- Another interesting side-effects of the List<> type is that, even when it’s cleared, it does not release the memory it has allocated (ie. the capacity remains the same). If you have a List with many elements, calling Clear() will not release this memory – it will just clear out its contents and set the count to zero. Similarly, adding new elements to this list will not allocate new memory, until capacity is reached.
So similarly to the first tip, if there’s a function that needs to populate and use large lists on every frame, a dirty but effective optimization is to pre-allocate a large list ahead of time, and keep reusing it and clearing after each use, which will not cause the memory to be re-allocated.
- Finally, a quick word about strings. Strings in C# and .NET are immutable objects, so string concatenation generates new string instances on the heap. When assembling strings from multiple components, it’s usually better to use a
StringBuilder, which has its own internal character buffer and can create a single new string instance at the end. Any instances of code that are single-threaded and not re-entrant could even share a single static instance of the builder, resetting it between invocations, so that the buffer gets reused between invocations.
Was it worth it?
I was inspired to collect all of these after a recent bout of optimizations, where I got rid of some pretty bad memory allocation spikes by digging in and simplifying code. In one particularly bad case, one frame allocated ~1MB of temporary objects just by using wrong data structures and iterators. Relieving memory pressure is especially important on mobile, since your texture memory and your game memory both have to share the same, very limited pool.
In the end, this list is not a set of rules set in stone, they’re just opportunities. I actually really like Linq, foreach, and other productivity extensions, and use them often (maybe too often). These optimizations only really matter when dealing with code that runs very frequently or deals with a ton of data, but most of the time they’re not necessary.
Ultimately, the standard approach to optimization is right: we should write good code first, then profile, and only then optimize actual observed hot spots, because each optimization reduces flexibility. And we all know what Knuth had to say about premature optimization.
In the last post, we looked at a number of surprises around memory allocation – such as heap trash being generated by foreach loops, array properties, or variadic functions. Throwaway objects on the heap can easily cause performance hiccups, so the less garbage we generate at runtime, the less we have to worry about memory pressure or garbage collection cost.
After the last post, several commenters on Gamasutra and on Reddit pointed out additional surprising memory allocations in Unity and Mono, when using structs or enums inside generic collections. I benchmarked them in a similar way as last time, and here are some of the interesting results.
In short, there are three more areas to watch out for, where we can observe unexpected garbage generation:
- lists of structs (including built-ins like Vector4)
- dictionaries keyed by structs
- dictionaries keyed by enums
We’ll talk about these in detail. But just to front-load the conclusions, here’s how to fix them:
- Make sure your structs implement IEquatable<T>
- Make sure your structs override Equals() and GetHashCode()
- Add a custom comparer to dictionaries keyed by enums
Pretty simple, huh? More details await. But first, a word or two about autoboxing.
size=2 width="100%" noshade style='color:#5F6168' align=center>
A Kind of Magic
Before we get into the weeds with structs and memory allocation, let’s very quickly refresh our memory about boxing and autoboxing. If you’re already familiar with this part of .NET, feel free to skip this section and jump straight to benchmarks below.
.NET draws a distinction between value types and reference types. Value types are things like primitives (int, float, etc) and structs, there are passed by value and can live on the stack, which greatly speeds up their creation and removal. Reference types (like class instances or strings) get passed by reference, always live on the heap, and get garbage-collected when not needed. Finally, when we try to pass a value that lives on the stack, into a place that expects a reference type such as the base “Object” class, the value will automatically get copied to the heap (boxed) for our convenience, and the reference will be passed around.
This last part – automatic, silent boxing of value types – is where most of our problems will be coming from.
For an example of boxing, consider functions like Object.Equals(object). It accepts a reference type as its parameter, so if we pass in a value object from the stack, it’s going to get automatically boxed first. Similar boxing happens when up-casting a value object to the base “Object” class, like in this snippet:
object obj = 1;
bool flag = obj.Equals(2);
That turns into this unfortunate snippet of IL code (as seen in ILSpy):
IL_0000: ldc.i4.1
IL_0001: box [mscorlib]System.Int32
IL_0006: stloc.0
IL_0007: ldloc.0
IL_0008: ldc.i4.2
IL_0009: box [mscorlib]System.Int32
IL_000e: callvirt instance bool [mscorlib]System.Object::Equals(object)
IL_0013: stloc.1
This shows both of the boxing examples mentioned above: first when take a reference to the integer “1” as an object, and second when we pass the integer “2” into System.Object.Equals(object).
While autoboxing is convenient and usually very cheap, the downside is that very often the copied, boxed reference object is just going to get thrown away, right after it’s created and used. This trash accumulates on the heap and puts pressure on the garbage collector, which will have to stop the world and do some cleanup. It would be better if we could just avoid trash generation altogether.
Ok, let’s take a look at some numbers.
(As in the previous installment, a caveat: the following measurements are taken using Unity’s performance profiler, using a standalone build under Unity 5.1 on an Intel i7 desktop machine. Yes, I’m aware of the limitations of synthetic benchmarks – use these as rough guidelines, always profile your own production code, etc. Also, these kinds of effects only start to matter when performing thousands of operations per frame. The standard rule of optimization applies: we should write readable and maintainable code first, then profile, and only then optimize actual observed hot spots, because each optimization reduces flexibility.)
I Want It All
First, let’s look at searching over generic lists of structs. Let’s say we create some structs like this:
public struct SmallStruct {
// 2 int fields. total size: 2 * 4 B + 8 B = 16 B
public int a, b;
}
public struct LargeStruct {
// 20 int fields. total size: 20 * 4 B + 8 B = 88 B
public int a, b, /* ... more here */;
}
Then we create a List<SmallStruct>, and start using and querying it, for example using List<T>.Contains(T value).
If you come from a C++ background and familiarity with the STL, you might think that given all this type information, and since we’re using a strongly typed collection, the compiler might be smart enough to avoid boxing.
Unfortunately, when we try this, we get performance numbers like this:
// List<T>.Contains(T) over a list with 128K struct elements:
mem alloc time
SmallStruct ................... 4.0 MB ....... 28 ms
LargeStruct ................... 22.0 MB ....... 70 ms
This is an unpleasant surprise. It looks like Contains() creates not one, but twotemporary copies of each element in the list! (For example: 2 * 128K * 16B per small struct = 4MB)
What’s going on? Contains() should be a simple function that just iterates over all elements and compares them. But there are two problems:
- Without any hints from us, the compiler will call the equality function on the base class:
ValueType.Equals(object)which will box the struct during the function call - The base
ValueType.Equals()knows nothing about the struct it’s working on, so it has to use reflection to get the fields and compare them one by one. This is implementation-specific, but also seems to cause allocations proportional to the size of the struct.
So if we just wrote our own version of Equals() that compares structs our own way, could we get some speedup? Let’s see:
// List<T>.Contains() over a list with 128K struct elements
// structs override Equals(), GetHashCode()
SmallStruct ................... 2.0 MB ....... 12 ms
LargeStruct ................... 11.0 MB ....... 26 ms
UnityEngine.Vector4 ........... 3.0 MB ....... 15 ms
(By the way, as you can see I also threw in the built-in UnityEngine.Vector4struct, because it also overrides Equals(). Lists of built-in Vectors suffer from spurious allocations as well.)
So far so good, these numbers look better, and now we merely duplicate the elements once during each call to Contains(). Progress! But what we reallywant is for the collection to use a type-specific Equals(T) function, instead of Equals(object), so that we can avoid boxing completely.
We do that by having our structs implement IEquatable<T>, which is the “magic” interface used by generic collections to instantiate type-specific equalizers.
And the results are:
// List<T>.Contains() over a list with 128K struct elements
// structs implement IEquatable<T>
SmallStruct ................... 0 B ....... 2 ms
LargeStruct ................... 0 B ....... 8 ms
That’s much better. By implementing this interface we got rid of boxing and sped up iteration time. High fives all around.
The main takeaway here is knowing that the IEquatable<T> interface is there, and should be implemented by all structs that will be used in generic collections (or, in other words, all structs).
Another One Bites the Dust
Generic dictionaries also present a challenge when using structs as keys.
In this following test we’ll stress key comparisons, by continually calling Dictionary<K,V>.ContainsKey().
Performance of just a plain struct used as a key can be surprisingly bad:
// dict is a tiny Dictionary<K,V> with just one entry
// 128K calls to dict.ContainsKey()
SmallStruct ................... 2.0 MB ....... 20 ms
LargeStruct ................... 11.0 MB ....... 52 ms
Once again, we’re getting memory thrashing consistent with spurious boxing on each call (128K * 16B = 2MB).
Also, since we’re using structs as keys, the dictionary will use the default ValueType.GetHashCode() hashing function, which does hashing in some implementation-specific way that figures out the right hash regardless of what struct it’s operating on (so probably not the fastest).
Let’s try the same tactics that we applied to lists, and see how they work:
// 128K calls to dict.ContainsKey(SmallStruct)
plain ................................... 2.0 MB ....... 20 ms
IEquatable<T> ........................... 2.0 MB ....... 20 ms
Equals(), GetHashCode() ................ 2.0 MB ....... 14 ms
IEquatable<T>, Equals(), GetHashCode() .. 0 B ....... 2 ms
// 128K calls to dict.ContainsKey(LargeStruct)
plain .................................. 11.0 MB ....... 52 ms
IEquatable<T> .......................... 11.0 MB ....... 52 ms
Equals(), GetHashCode() ................ 11.0 MB ....... 38 ms
IEquatable<T>, Equals(), GetHashCode() .. 0 B ....... 13 ms
Just as before, we get the best performance if we implement our own better, faster tests for equality, and our own hashing routine.
In fact, when implementing custom structs, the best practice is to do all of the following:
- provide a type-specific equality comparison function via
IEquatable<T> - override
GetHashCode()andEquals()with faster (custom) versions - likewise, override operators
==and!=to use strongly typed equality checks
Alternatively, you could make your own implementation of IEqualityComparer<T>, and pass it in to the dictionary, to avoid boxing in a similar way, but that needs to happen on a per-collection basis instead of once for the whole struct.
Unfortunately, built-in structs like Vector3 follow only some of these guidelines, and so they might not have the best performance when stored inside generic collections.
By the way, you might have noticed that we always override Equals() and GetHashCode() together. Why is this?
These two functions must be compatible with each other, for collections like Dictionaries to work correctly. Specifically, whenever two objects are equal, they must return the same hash code. (Imagine if they didn’t – then a value might never be found inside a collection.)
There are some specific rules that need to be followed when implementing those two functions, which I’m going to describe quickly, and refer you to Bill Wagner’s Effective C# for all the sordid, checkered details:
- Custom
Equals()predicate must be:- Reflexive (
a == ais always true) - Symmetrical (if
a == bthenb == a) - Transitive (if
a == bandb == cthena == c)
- Reflexive (
- Custom
GetHashCode()must follow:- If
a.Equals(b)then both must generate the same hash code - If object is modified but the change doesn’t affect the output of
Equals(), the hash code must remain the same- In practice this is important for reference types, but not much of an issue for structs used as keys in collections, because it’s not possible to get a reference to a struct used as a key inside a generic collection and modify it.
- If
Also, hash codes should be uniformly distributed over the space of signed integers, for optimal performance.
I’m Going Slightly Mad
Finally, let’s talk about enums.
This is another interesting departure from C or C++. In those languages, enum is essentially interconvertible with one of the int types.
In .NET, enum is also backed by int (or some other integral type of your choosing), but because of that it’s a value type, inheriting various functionality from their ValueType parent class.
Given this preamble, you probably won’t be very surprised to see these kinds of performance numbers:
// loop of 128K iterations, a and b are enums
// enum does not implement IEquatable<T>
1. a == b ....................... - B ...... 0.1 ms
2. (int)a == (int)b ............. - B ...... 0.1 ms
3. a.Equals(b) .................. 3.0 MB ...... 24.0 ms
In fact, both cases 1 and 2 result in the same IL code:
// result = (a == b);
IL_0007: ldsfld valuetype TestEnum BaseEnumTest::a
IL_000c: ldsfld valuetype TestEnum BaseEnumTest::b
IL_0011: ceq
… while the third case causes double boxing:
// result = a.Equals(b);
IL_0007: ldsfld valuetype TestEnum BaseEnumTest::a
IL_000c: box TestEnum
IL_0011: ldsfld valuetype TestEnum BaseEnumTest::b
IL_0016: box TestEnum
IL_001b: callvirt instance bool [mscorlib]System.Enum::Equals(object)
And once we start using them as keys in dictionaries, we get behavior like this:
// loop of 128k lookups keyed by enum
//
// edict is of type Dictionary<TestEnum, int>
// idict is of type Dictionary<int, int>
1. result = edict[enum] .......... 4.5 MB ...... 40 ms
2. result = idict[int] ........... - B ...... 2 ms
Confusingly enough, this first behavior is not due to boxing on our end, but there is heap allocation going on inside the dictionary when it encounters an enum key. This is a bit unfortunate, since dictionaries keyed by enums are very, very convenient, eg. for converting from enums to human readable strings. (Thanks to Lucas Meijer for more info on this.)
Fortunately, we can get around that, in two ways. First, we can implement our own IEqualityComparer<T> for the enum type, and pass that into the Dictionary constructor, and that will successfully avoid boxing as well. (Thanks to Borut Pfeifer for this tip!) The second options is to cast enums into ints, and use an int-keyed dictionary.
Here’s a comparison:
// loop of 128k lookups
// edict is of type Dictionary<TestEnum, int>
// newedict is same as edict, but with a custom IEqualityComparer<T>
// idict is of type Dictionary<int, int>
1. result = edict[enum] ..................... 4.5 MB ...... 40 ms
2. result = newedict[enum] .................. - B ...... 2 ms
3. result = idict[(int)enum] ................ - B ...... 2 ms
Once again, the trick is in knowing that something like this is happening, and needs action on our part. Either of these is a relatively small price to pay in exchange for not generating 36 bytes of garbage on each invocation.
Play the Game
Hopefully this was an interesting and useful jog through the far away lands where value types and generic collections intersect.
These areas are not well known and explored, but they’re interesting – and good to know, especially for those of us coming from languages like C or C++, where enums, structs, and data structures look quite similar, but behave very, very differently.
C# Memory Management for Unity Developers
[Note: This post presupposes 'intermediate' knowledge of C# and Unity.]
I'm going to start this post with a confession. Although raised as a C/C++ developer, for a long time I was a secret fan of Microsoft's C# language and the .NET framework. About three years ago, when I decided to leave the Wild West of C/C++-based graphics libraries and enter the civilized world of modern game engines, Unity stood out with one feature that made it an obvious choice for myself. Unity didn't require you to 'script' in one language (like Lua or UnrealScript) and 'program' in another. Instead, it had deep support for Mono, which meant all your programming could be done in any of the .NET languages. Oh joy! I finally had a legitimate reason to kiss C++ goodbye and have all my problems solved by automatic memory managment. This feature had been built deeply into the C# language and was an integral part of its philosophy. No more memory leaks, no more thinking about memory management! My life would become so much easier.
![]()
Don't show this to your players.
If you have even the most casual acquaintance with Unity and/or game programming, you know how wrong I was. I learned the hard way that in game developement, you cannot rely on automatic memory managment. If your game or middleware is sufficiently complex and resource-demanding, developing with C# in Unity is therefore a bit like walking a few steps backwards in the direction of C++. Every new Unity developer quickly learns that memory management is a problematic issue that cannot simply be entrusted to the Common Language Runtime (CLR). The Unity forums and many Unity-related blogs contain several collections of tips and best practices concerning memory. Unfortunately, not all of these are based on solid facts, and to the best of my knowledge, none of them are comprehensive. Furthermore, C# experts on sites such as Stackoverflow often seem to have little patience for the quirky, non-standard problems faced by Unity developers. For these reasons, in this and the following two blog posts, I try to give an overview and hopefully some in-depth knowlege on Unity-specific memory management issues in C#.
- This first post discusses the fundamentals of memory management in the garbage-collected world of .NET and Mono. I also discuss some common sources of memory leaks.
- The second looks at tools for discovering memory leaks. The Unity Profiler is a formidable tool for this purpose, but it's also expensive. I therefore discuss .NET disassemblers and the Common Intermediate Language (CIL) to show you how you can discover memory leaks with free tools only.
- The third post discusses C# object pooling. Again, the focus is on the specific needs that arise in Unity/C# development.
I'm sure I've overlooked some important topics - mention them in the comments and I may write them up in a post-script.
Limits to garbage collection
Most modern operating systems divide dynamic memory into stack and heap (1, 2), and many CPU architectures (including the one in your PC/Mac and your smartphone/tablet) support this division in their instruction sets. C# supports it by distinguishing value types (simple built-in types as well as user-defined types that are declared as enum or struct) and reference types (classes, interfaces and delegates). Value types are allocated on the stack, reference types on the heap. The stack has a fixed size which is set at the start of a new thread. It's usually small - for instance, .NET threads on Windows default to a stack size of 1Mb. This memory is used to load the thread's main function and local variables, and subsequently load and unload functions (with their local variables) that are called from the main one. Some of it may be mapped to the CPU's cache to speed things up. As long as the call depth isn't excessively high or your local variables huge, you don't have to fear a stack overflow. And you see that this usage of the stack aligns nicely with the concept of structured programming.
If objects are too big to fit on the stack, or if they have to outlive the function they were created in, the heap comes into play. The heap is 'everything else' - a section of memory that can (usually) grow as per request to the OS, and over which the program rules as it wishes. But while the stack is almost trivial to manage (just use a pointer to remember where the free section begins), the heap fragments as soon as the order in which you allocate objects diverges from the order in which you deallocate them. Think of the heap as a Swiss cheese where you have to remember all the holes! Not fun at all. Enter automatic memory management. The task of automated allocation - mainly, keeping track of all the holes in the cheese for you - is an easy one, and supported by virtually all modern programming languages. Much harder is the task of automatic deallocation, especially deciding when an object is ready for deallocation, so that you don't have to.
This latter task is called garbage collection (GC). Instead of you telling your runtime environment when an object's memory can be freed, the runtime keeps track of all the references to an object and is thereby able to determine - at certain intervals - when an object cannot possibly be reached anymore from your code. Such an object can then be destroyed and it's memory gets freed. GC is still actively researched by academics, which explains why the GC architecture has changed and improved significantly in the .NET framework since version 1.0. However, Unity doesn't use .NET but it's open-source cousin, Mono, which continues to lag behind it's commercial counterpart. Furthermore, Unity doesn't default to the latest version (2.11 / 3.0) of Mono, but instead uses version 2.6 (to be precise, 2.6.5 on my Windows install of Unity 4.2.2 [EDIT: the same is true for Unity 4.3]). If you are unsure about how to verify this yourself, I will discuss it in the next blog post.
One of the major revisions introduced into Mono after version 2.6 concerned GC. New versions use generational GC, whereas 2.6 still uses the less sophisticated Boehm garbage collector. Modern generational GC performs so well that it can even be used (within limits) for real-time applications such as games. Boehm-style GC, on the other hand, works by doing an exhaustive search for garbage on the heap at relatively 'rare' intervals (i.e., usually much less frequently than once-per-frame in a game). It therefore has an overwhelming tendency to create drops in frame-rate at certain intervals, thereby annoying your players. The Unity docs recommend that you call System.GC.Collect() whenever your game enters a phase where frames-per-second matter less (e.g., loading a new level or displaying a menu). However, for many types of games such opportunities occur too rarely, which means that the GC might kick in before you want it too. If this is the case, your only option is to bite the bullet and manage memory yourself. And that's what the remainder of this post and the following two posts are about!
Becoming your own Memory Manager
Let's be clear about what it means to 'manage memory yourself' in the Unity / .NET universe. Your power to influence how memory is allocated is (fortunately) very limited. You get to choose whether your custom data structures are class (always allocated on the heap) or struct (allocated on the stack unless they are contained within a class), and that's it. If you want more magical powers, you must use C#'s unsafekeyword. But unsafe code is just unverifiable code, meaning that it won't run in the Unity Web Player and probably some other target platforms. For this and other reasons, don't use unsafe. Because of the above-mentioned limits of the stack, and because C# arrays are just syntactic sugar for System.Array(which is a class), you cannot and should not avoid automatic heap allocation. What you should avoid are unnecessary heap allocations, and we'll get to that in the next (and last) section of this post.
Your powers are equally limited when it comes to deallocation. Actually, the only process that can deallocate heap objects is the GC, and its workings are shielded from you. What you can influence is when the last reference to any of your objects on the heap goes out of scope, because the GC cannot touch them before that. This limited power turns out to have huge practical relevance, because periodic garbage collection (which you cannot suppress) tends to be very fast when there is nothing to deallocate. This fact underlies the various approaches to object pooling that I discuss in the third post.
Common causes of unnecessary heap allocation
Should you avoid foreach loops?
A common suggestion which I've come across many times in the Unity forums and elsewhere is to avoid foreach loops and use for or while loops instead. The reasoning behind this seems sound at first sight. Foreach is really just syntactic sugar, because the compiler will preprocess code such as this:
foreach (SomeType s in someList)
s.DoSomething();
...into something like the the following:
using (SomeType.Enumerator enumerator = this.someList.GetEnumerator())
{
while (enumerator.MoveNext())
{
SomeType s = (SomeType)enumerator.Current;
s.DoSomething();
}
}
In other words, each use of foreach creates an enumerator object - an instance of the System.Collections.IEnumerator interface - behind the scenes. But does it create this object on the stack or on the heap? That turns out to be an excellent question, because both are actually possible! Most importantly, almost all of the collection types in the System.Collections.Generic namespace (List<T>, Dictionary<K, V>, LinkedList<T>, etc.) are smart enough to return a struct from from their implementation of GetEnumerator()). This includes the version of the collections that ships with Mono 2.6.5 (as used by Unity).
[EDIT] Matthew Hanlon pointed my attention to an unfortunate (yet also very interesting) discrepancy between Microsoft's current C# compiler and the older Mono/C# compiler that Unity uses 'under the hood' to compile your scripts on-the-fly. You probably know that you can use Microsoft Visual Studio to develop and even compile Unity/Mono compatible code. You just drop the respective assembly into the 'Assets' folder. All code is then executed in a Unity/Mono runtime environment. However, results can still differ depending on who compiled the code! foreach loops are just such a case, as I've only now figured out. While both compilers recognize whether a collection's GetEnumerator() returns a struct or a class, the Mono/C# has a bug which 'boxes' (see below, on boxing) a struct-enumerator to create a reference type.
So should you avoid foreach loops?
- Don't use them in C# code that you allow Unity to compile for you.
- Do use them to iterate over the standard generic collections (List<T> etc.) in C# code that you compile yourself with a recent compiler. Visual Studio as well as the free .NET Framework SDK are fine, and I assume (but haven't verified) that the one that comes with the latest versions of Mono and MonoDevelop is fine as well.
What about foreach-loops to iterate over other kinds of collections when you use an external compiler? Unfortunately, there's is no general answer. Use the techniques discussed in the second blog post to find out for yourself which collections are safe for foreach. [/EDIT]
Should you avoid closures and LINQ?
You probably know that C# offers anonymous methods and lambda expressions (which are almost but not quite identical to each other). You can create them with the delegate keyword and the => operator, respectively. They are often a handy tool, and they are hard to avoid if you want to use certain library functions (such as List<T>.Sort()) or LINQ.
Do anonymous methods and lambdas cause memory leaks? The answer is: it depends. The C# compiler actually has two very different ways of handling them. To understand the difference, consider the following small chunk of code:
int result = 0;
void Update()
{
for (int i = 0; i < 100; i++)
{
System.Func<int, int> myFunc = (p) => p * p;
result += myFunc(i);
}
}
As you can see, the snippet seems to create a delegate myFunc 100 times each frame, using it each time to perform a calculation. But Mono only allocates heap memory the first time the Update() method is called (52 Bytes on my system), and doesn't do any further heap allocations in subsequent frames. What's going on? Using a code reflector (as I'll explain in the next blog post), one can see that the C# compiler simply replaces myFunc by a static field of type System.Func<int, int> in the class that contains Update(). This field gets a name that is weird but also revealing: f__am$cache1 (it may differ somewhat on you system). In other words, the delegator is allocated only once and then cached.
Now let's make a minor change to the definition of the delegate:
System.Func<int, int> myFunc = (p) => p * i++;
By substituting 'i++' for 'p', we've turned something that could be called a 'locally defined function' into a true closure. Closures are a pillar of functional programming. They tie functions to data - more precisely, to non-local variables that were defined outside of the function. In the case of myFunc, 'p' is a local variable but 'i' is non-local, as it belongs to the scope of the Update() method. The C# compiler now has to convert myFunc into something that can access, and even modify, non-local variables. It achieves this by declaring (behind the scenes) an entirely new class that represents the reference environment in which myFunc was created. An object of this class is allocated each time we pass through the for-loop, and we suddenly have a huge memory leak (2.6 Kb per frame on my computer).
Of course, the chief reason why closures and other language features where introduced in C# 3.0 is LINQ. If closures can lead to memory leaks, is it safe to use LINQ in your game? I may be the wrong person to ask, as I have always avoided LINQ like the plague. Parts of LINQ apparently will not work on operating systems that don't support just-in-time compilation, such as iOS. But from a memory aspect, LINQ is bad news anyway. An incredibly basic expression like the following:
int[] array = { 1, 2, 3, 6, 7, 8 };
void Update()
{
IEnumerable<int> elements = from element in array
orderby element descending
where element > 2
select element;
...
}
... allocates 68 Bytes on my system in every frame (28 via Enumerable.OrderByDescending() and 40 via Enumerable.Where())! The culprit here isn't even closures but extension methods to IEnumerable: LINQ has to create intermediary arrays to arrive at the final result, and doesn't have a system in place for recycling them afterwards. That said, I am not an expert on LINQ and I do not know if there are components of it that can be used safely within a real-time environment.
Coroutines
If you launch a coroutine via StartCoroutine(), you implicitly allocate both an instance of Unity's Coroutine class (21 Bytes on my system) and an Enumerator (16 Bytes). Importantly, no allocation occurs when the coroutine yield's or resumes, so all you have to do to avoid a memory leak is to limit calls to StartCoroutine() while the game is running.
Strings
No overview of memory issues in C# and Unity would be complete without mentioning strings. From a memory standpoint, strings are strange because they are both heap-allocated and immutable. When you concatenate two strings (be they variables or string-constants) as in:
void Update()
{
string string1 = "Two";
string string2 = "One" + string1 + "Three";
}
... the runtime has to allocate at least one new string object that contains the result. In String.Concat() this is done efficiently via an external method called FastAllocateString(), but there is no way of getting around the heap allocation (40 Bytes on my system in the example above). If you need to modify or concatenate strings at runtime, use System.Text.StringBuilder.
Boxing
Sometimes, data have to be moved between the stack and the heap. For example, when you format a string as in:
string result = string.Format("{0} = {1}", 5, 5.0f);
... you are calling a method with the following signature:
public static string Format(
string format,
params Object[] args
)
In other words, the integer "5" and the floating-point number "5.0f" have to be cast to System.Objectwhen Format() is called. But Object is a reference type whereas the other two are value types. C# therefore has to allocate memory on the heap, copy the values to the heap, and hand Format() a reference to the newly created int and float objects. This process is called boxing, and its counterpart unboxing.
This behavior may not be a problem with String.Format() because you expect it to allocate heap memory anway (for the new string). But boxing can also show up at less expected locations. A notorious example occurs when you want to implement the equality operator "==" for your home-made value types (for example, a struct that represents a complex number). Read all about how to avoid hidden boxing in such cases here.
Library methods
To wind up this post, I want to mention that various library methods also conceal implicit memory allocations. The best way to catch them is through profiling. Two interesting cases which I've recently come across are these:
- I wrote earlier that a foreach-loop over most of the standard generic collections does not result in heap allocations. This holds true for Dictionary<K, V> as well. However, somewhat mysteriously, Dictionary<K, V>.KeyCollection and Dictionary<K, V>.ValueCollection are classes, not structs, which means that "foreach (K key in myDict.Keys)..." allocates 16 Bytes. Nasty!
- List<T>.Reverse() uses a standard in-place array reversal algorithm. If you are like me, you'd think that this means that it doesn't allocate heap memory. Wrong again, at least with respect to the version that comes with Mono 2.6. Here's an extension method you can use instead which may not be as optimized as the .NET/Mono version, but at least manages to avoid heap allocation. Use it in the same way you would use List<T>.Reverse():
public static class ListExtensions
{
public static void Reverse_NoHeapAlloc<T>(this List<T> list)
{
int count = list.Count;
for (int i = 0; i < count / 2; i++)
{
T tmp = list[i];
list[i] = list[count - i - 1];
list[count - i - 1] = tmp;
}
}
}
***
There are other memory traps which could be written about. However, I don't want to give you any more fish, but teach you how to catch your own fish. Thats what the next post is about!
[The first installment of this three-part series discussed the basics of memory management in .NET/Mono and Unity, and offered some tips for avoiding unnecessary heap allocations. The third dives into object pooling. All parts are intended primarily for 'intermediate'-level C# developers.]
Let's now take a close look at two paths to finding unwanted heap allocations in your project. The first path - the Unity profiler - is almost ridiculously easy to use, but has the not-so-minor drawback of costing a considerable amount of money, as it only comes with Unity's commercial 'Pro' version. The second path involves disassembling your .NET/Mono assemblies into Common Intermediate Language (CIL) and inspecting them afterwards. If you've never seen disassembled .NET code before, read on, it's not hard and it's also free and extremely educational. Below, I intend to teach you just enough CIL so you can investigate the real memory allocation behavior of your own code.
The easy path: using Unity's profiler
Unity's excellent profiler is chiefly geared at analyzing the performance and the resource demands of the various types of assets in your game: shaders, textures, sound, gameobjects, and so on. Yet the profiler is equally useful for digging into the memory-related behavior of your C# code - even of external .NET/Mono assemblies that don't reference UnityEngine.dll! In the current version of Unity (4.3), this functionality isn't accessible from the Memory profiler but from the CPU profiler. When it comes to your C# code, the Memory profiler only shows you the Total size and the Used amount of the Mono heap.

This is too coarse to allow you to see if you have any memory leaks stemming from your C# code. Even if you don't use any scripts, the 'Used' size of the heap grows and contracts continuously. As soon as you do use scripts, you need a way to see where allocations occur, and the CPU profiler gives you just that.
Let's look at some example code. Assume that the following script is attached to some GameObject.
using UnityEngine;
using System.Collections.Generic;
public class MemoryAllocatingScript : MonoBehaviour
{
void Update()
{
List<int> iList = new List<int>(new int[] { 072, 101,
108, 108, 111, 032, 119, 111, 114, 108, 100, 033 });
string result = "";
foreach (int i in iList.ToArray())
result += ((char)i).ToString();
Debug.Log(result);
}
}
All it does is build a string ("Hello world!") from a bunch of integers in a circuitous manner, making some unnecessary allocations along the way. How many? I'm glad you asked, but as I'm lazy, let's just look at the CPU profiler. With "Deep Profile" checked at the top of the window, it traces the call tree as deeply as it can at every frame.

As you can see, heap memory is allocated at five different places during our Update(). The initialization of the list, it's redundant conversion to an array in the foreach loop, the conversion of each number into a string and the concatenations all require allocations. Interestingly, the mere call to Debug.Log() also allocates a huge chunk of memory - something to keep in mind even if it's filtered out in production code.
If you don't have Unity Pro, but happen to own a copy of Microsoft Visual Studio, note that there are alternatives to the Unity Profiler which have a similar ability to drill into the call tree. Telerik tells me that their JustTrace Memory profiler has similar functionality (see here). However, I do not know how well it replicates Unity's ability to record the call tree at each frame. Furthermore, although remote-debugging of Unity projects in Visual Studio (via UnityVS, one of my favorite tools) is possible, I haven't succeeded in bringing JustTrace to profile assemblies that are called by Unity.
The only slightly harder path: disassembling your own code
Background on CIL
If you already own a .NET/Mono disassembler, fire it up now, otherwise I can recommend ILSpy. This tool is not only free, it's also clean and simple, yet happens to include one specific feature which we need further below.
You probably know that the C# compiler doesn't translate your code into machine language, but into the Common Intermediate Language. This language was developed by the original .NET team as a low-level language that incorporates two features from higher-level languages. On one hand, it is hardware-independent, and on the other, it includes features that might best be called 'object-oriented', such as the ability to refer to modules (other assemblies) and classes.
CIL code that hasn't been run through a code obfuscator is surprisingly easy to reverse-engineer. In many cases, the result is almost identical to the original C# (VB, ...) code. ILSpy can do this for you, but we shall be satisfied to merely disassemble code (which ILSpy achieves by calling ildasm.exe, which is part of .NET/Mono). Let's start with a very simple method that adds two integers.
int AddTwoInts(int first, int second)
{
int result = first + second;
return result;
}
If you wish, you can paste this code into the MemoryAllocatingScript.cs file from above. Then make sure that Unity compiles it, and open the compiled library Assembly-Csharp.dll in ILSpy (the library should be in the directory Library\ScriptAssemblies of your Unity project). If you select the AddTwoInts() method in this assembly, you'll see the following.

Except for the blue keyword hidebysig, which we can ignore, the method signature should look quite familiar. To get the gist of what happens in the method body, you need to know that CIL thinks of your computer's CPU as a stack machine as opposed to a register machine. CIL assumes that the CPU can handle very fundamental, mostly arithmetic instructions such as "add two integers", and that it can also handle random access of any memory address. CIL also assumes that the CPU doesn't perform arithmetic directly 'on' the RAM, but needs to load data into the conceptual 'evaluation stack' first. (Note that the evaluation stack has nothing to do with the C# stack that you know by now. The CIL evaluation stack is just an abstraction, and presumed to be small.) What happens in lines IL_0000 to IL_0005 is this:
- The two integer parameters get pushed on the stack.
- add get's called and pops the first two items from the stack, automatically pushing it's result back on the stack.
- Lines 3 and 4 can be ignored because they would be optimized away in a release build.
- The method returns the first value on the stack (the added result).
Finding memory allocations in CIL
The beauty of CIL-code is that it doesn't conceal heap allocations. Instead, heap allocations can occur in exactly the following three instructions, visible in your disassembled code.
- newobj <constructor>: This creates an uninitialized object of the type specified via the constructor. If the object is a value type (struct etc.), it is created on the stack. If it is a reference typ (class etc.) it lands on the heap. You always know the type from the CIL code, so you can tell easily where the allocation occurs.
- newarr <element type>: This instruction creates a new array on the heap. The type of elements is specified in the a parameter.
- box <value type token>: This very specialized instruction performs boxing, which we already discussed in the first part of this series.
Let's look at a rather contrived method that performs all three types of allocations.
void SomeMethod()
{
object[] myArray = new object[1];
myArray[0] = 5;
Dictionary<int, int> myDict = new Dictionary<int, int>();
myDict[4] = 6;
foreach (int key in myDict.Keys)
Console.WriteLine(key);
}
The amount of CIL code generated from these few lines is huge, so I'll just show the key parts here:
IL_0001: newarr [mscorlib]System.Object
...
IL_000a: box [mscorlib]System.Int32
...
IL_0010: newobj instance void class [mscorlib]System.
Collections.Generic.Dictionary'2<int32, int32>::.ctor()
...
IL_001f: callvirt instance class [mscorlib]System.
Collections.Generic.Dictionary`2/KeyCollection<!0, !1>
class [mscorlib]System.Collections.Generic.Dictionary`2<int32,
int32>::get_Keys()
As we already suspected, the array of objects (first line in SomeMethod()) leads to a newarr instruction. The integer '5', which is assigned to the first element of this array, needs a box. The Dictionary<int, int> is allocated with a newobj.
But there is a fourth heap allocation! As I mentioned in the first post, Dictionary<K, V>. KeyCollection is declared as a class, not a struct. An instance of this class is created so that the foreach loop has something to iterate over. Unfortunately, the allocation happens in a special getter method for the Keys field. As you can see in the CIL code, the name of this method is get_Keys(), and its return value is a class. Looking through this code, you might therefore already suspect that something fishy is going on. But to see the actual newobj instruction that allocates the KeyCollection instance, you have to visit the mscorlib assembly in ILSpy and navigate to get_Keys().
As a general strategy for finding memory leaks, you can create a CIL-dump of your entire assembly by pressing Ctrl+S (or File -> Save Code) in ILSpy. You then open this file in your favourite text editor and search for the three mentioned instructions. Getting at allocations that occur in other assemblies can be hard work, though. The only strategy I know is to look carefully through your C# code, identify all external method calls, and inspect their CIL code one-by-one. How do you know when you're done? Easy: your game can run smoothly for hours, without producing any performance spikes due to garbage collection.
***
PS: In the previous post, I promised to show you how you could verify the version of Mono installed on your system. With ILSpy installed, nothing's easier than that. In ILSpy, click Open and find your Unity base directory. Navigate to Data/Mono/lib/mono/2.0 and open mscorlib.dll. In the hierarchy, go to mscorlib/-/Consts, and there you'll find MonoVersion as a string constant.
[The first installment of this three-part series discussed the basics of memory management in .NET/Mono and Unity, while the second dived into the Unity Profiler and CIL to discover unwanted memory allocations in your C# code.]
This third post is about object pooling. We've hitherto focused on heap allocations. Now we also want to avoid unnecessary deallocations, so that while our game is running, the garbage collector (GC) doesn't create those ugly drops in frames-per-second. Object pooling is ideal for this purpose. I will present complete code for three kinds of object pools. (You can also find them as a gist on Github.)
Starting with a very simple pool class
The idea behind object pooling is extremely simple. Instead of creating new objects with the new operator and allowing them to become garbage later, we store used objects in a pool and reuse them as soon as they're needed again. The single most important feature of the pool - really the essence of the object-pooling design pattern - is to allow us to acquire a 'new' object while concealing whether it's really new or recycled. This pattern can be realized in a few lines of code:
public class ObjectPool<T> where T : class, new()
{
private Stack<T> m_objectStack = new Stack<T>();
public T New()
{
return (m_objectStack.Count == 0) ? new T() : m_objectStack.Pop();
}
public void Store(T t)
{
m_objectStack.Push(t);
}
}
Simple, yes, but a perfectly good realization of the core pattern. (If you're confused by the "where T..." part, it is explained below.) To use this class, you have to replace allocations that make use of the new operator, such as here...
void Update()
{
MyClass m = new MyClass();
}
... with paired calls to New() and Store():
ObjectPool<MyClass> poolOfMyClass = new ObjectPool<MyClass>();
void Update()
{
MyClass m = poolOfMyClass.New();
// do stuff...
poolOfMyClass.Store(m);
}
This is annoying because you'll need to remember to call Store(), and do so at the right place. Unfortunately, there is no general way to simplify this usage pattern further because neither the ObjectPool class nor the C# compiler can know when your object has gone out of scope. Well, actually, there is one way - it is called automatic memory managment via garbage collection, and it's shortcomings are the reason you're reading these lines in the first place! That said, in some fortunate situations, you can use a pattern explaind under "A pool with collective reset" at the end of this article. There, all your calls to Store() are replaced by a single call to a ResetAll() method.
Adding complexity to the ObjectPool class
I'm a big fan of simplicity in code as well as life, the universe and everything, but the ObjectPool class is perhaps a bit too simple in its current state. If you search around for object pooling libraries in C#, you will find a variety of solutions, some of them rather sophisticated and complex. So let's take a step back and think about what additional functions we might - or might not - like to find in a generic object pooling class.
- Many types of objects need to be 'reset' in some way before they can be reused. At a minimum, all member variables may be set to their default state. This can be handled transparently by the pool, rather than by the user. When and how to reset is a matter of design that relates to the following two distinctions.
- Resetting can be eager (i.e., executed at the time of storage) or lazy (executed right before the object is reused).
- Resetting can be managed by the pool (i.e., transparently to the class that is being pooled) or by the class (transparently to the person who is declaring the pool object).
- In the example above, the object pool 'poolOfMyClass' had to be declared explicitly with class-level scope. Obviously, a new such pool would have to be declared for each new type of resource (My2ndClass etc.). Alternatively, it is possible to have the ObjectPool class create and manage all these pools transparently to the user.
- Several object-pooling libraries you find out there aspire to manage very heterogeneous kinds of scarce resources (memory, database connections, game objects, external assets etc.). This tends to boost the complexity of the object pooling code, as the logic behind handling such diverse resources varies a great deal.
- Some types of resources (e.g., database connections) are so scarce that the pool needs to enforce an upper limit and offer a safe way of failing to allocate a new/recycled object.
- If objects in the pool are used in large numbers at relatively 'rare' moments, we may want the pool to have the ability to shrink (either automatically or on-demand).
- Finally, the pool can be shared by several threads, in which case it would have to be thread-safe.
Which of these are worth implementing? Your answer may differ from mine, but allow me to explain my own preferences.
- Yes, the ability to 'reset' is a must-have. But, as you will see below, there is no point in choosing between having the reset logic handled by the pool or by the managed class. You are likely to need both, and the code below will show you one version for each case.
- Unity imposes limitations on your multi-threading - basically, you can have worker threads in addition to the main game thread, but only the latter is allowed to make calls into the Unity API. In my experience, this means that we can get away with separate object pools for all our threads, and can thus delete 'support for multi-threading' from our list of requirements.
- Personally, I don't mind too much having to declare a new pool for each type of object I want to pool. The alternative means using the singleton pattern: you let your ObjectPool class create new pools as needed and store them in a dictionary of pools, which is itself stored in a static variable. To get this to work safely, you'd have to make your ObjectPool class multi-threaded. None of the multi-threaded object pooling solutions I've seen so far strike me as 100% safe, however...
- In line with the scope of this three-part blog, I'm only interested in pools that deal with one type of scarce resource: memory. Pools for other kinds of resources are important, too, but they're just not within the scope of this post. This really narrows down the remaining requirements.
- The pools presented here do not impose a maximum size. If your game uses too much memory, you are in trouble anyway, and it's not the object pool's business to fix this problem.
- By the same token, we can assume that no other process is currently waiting for you to release your memory as soon as possible. This means that resetting can be lazy, and that the pool doesn't have to offer the ability to shrink.
A basic pool with initialization and reset
Our revised ObjectPool<T> class looks as follows:
public class ObjectPool<T> where T : class, new()
{
private Stack<T> m_objectStack;
private Action<T> m_resetAction;
private Action<T> m_onetimeInitAction;
public ObjectPool(int initialBufferSize, Action<T>
ResetAction = null, Action<T> OnetimeInitAction = null)
{
m_objectStack = new Stack<T>(initialBufferSize);
m_resetAction = ResetAction;
m_onetimeInitAction = OnetimeInitAction;
}
public T New()
{
if (m_objectStack.Count > 0)
{
T t = m_objectStack.Pop();
if (m_resetAction != null)
m_resetAction(t);
return t;
}
else
{
T t = new T();
if (m_onetimeInitAction != null)
m_onetimeInitAction(t);
return t;
}
}
public void Store(T obj)
{
m_objectStack.Push(obj);
}
}
This implementation is very simple and straightforward. The parameter 'T' has two constraints that are specified by way of "where T : class, new()". Firstly, 'T' has to be a class (after all, only reference types need to be object-pooled), and secondly, it must have a parameterless constructor.
The constructor takes your best guess of the maximum number of objects in the pool as a first parameter. The other two parameters are (optional) closures - if given, the first closure will be used to reset a pooled object, while the second initializes a new one. ObjectPool<T> has only two methods besides its constructor, New() and Store(). Because the pool uses a lazy approach, all work happens in New(), where new and recycled objects are either initialized or reset. This is done via two closures that can optionally be passed to the constructor. Here is how the pool could be used in a class that derives from MonoBehavior.
class SomeClass : MonoBehaviour
{
private ObjectPool<List<Vector3>> m_poolOfListOfVector3 =
new ObjectPool<List<Vector3>>(32,
(list) => {
list.Clear();
},
(list) => {
list.Capacity = 1024;
});
void Update()
{
List<Vector3> listVector3 = m_poolOfListOfVector3.New();
// do stuff
m_poolOfListOfVector3.Store(listVector3);
}
}
If you've read the first post of this series, you know that the two delegates used in the definition of the ListOfVector3-pool are 'OK' from a memory standpoint. On one hand, they are not true closures but mere 'locally defined functions', and on the other hand, it doesn't even matter because the pool has class-level scope.
A pool that lets the managed type reset itself
The basic version of the object pool does what it is supposed to do, but it has one conceptual blemish. It violates the principle of encapsulation insofar as it separates the code for initializing / resetting an object from the definition of the object's type. This leads to tight coupling, and should be avoided if possible. In the SomeClass example above, there is no real alternative because we cannot go and change the definition of List<T>. However, when you use object pooling for your own types, you may want to have them implement the following simple interface IResetable instead. The corresponding class ObjectPoolWithReset<T> can hence be used without specifying any of the two closures as parameters (which I left in for the sake of flexibility).
public interface IResetable
{
void Reset();
}
public class ObjectPoolWithReset<T> where T : class, IResetable, new()
{
private Stack<T> m_objectStack;
private Action<T> m_resetAction;
private Action<T> m_onetimeInitAction;
public ObjectPoolWithReset(int initialBufferSize, Action<T>
ResetAction = null, Action<T> OnetimeInitAction = null)
{
m_objectStack = new Stack<T>(initialBufferSize);
m_resetAction = ResetAction;
m_onetimeInitAction = OnetimeInitAction;
}
public T New()
{
if (m_objectStack.Count > 0)
{
T t = m_objectStack.Pop();
t.Reset();
if (m_resetAction != null)
m_resetAction(t);
return t;
}
else
{
T t = new T();
if (m_onetimeInitAction != null)
m_onetimeInitAction(t);
return t;
}
}
public void Store(T obj)
{
m_objectStack.Push(obj);
}
}
A pool with collective reset
Some types of data structures in your game may never persist over a sequence of frames, but get retired at or before the end of each frame. In this case, when we have a well-defined point in time by the end of which all pooled objects can be stored back in the pool, we can rewrite the pool to be both easier to use and significantly more efficient. Let's look at the code first.
public class ObjectPoolWithCollectiveReset<T> where T : class, new()
{
private List<T> m_objectList;
private int m_nextAvailableIndex = 0;
private Action<T> m_resetAction;
private Action<T> m_onetimeInitAction;
public ObjectPoolWithCollectiveReset(int initialBufferSize, Action<T>
ResetAction = null, Action<T> OnetimeInitAction = null)
{
m_objectList = new List<T>(initialBufferSize);
m_resetAction = ResetAction;
m_onetimeInitAction = OnetimeInitAction;
}
public T New()
{
if (m_nextAvailableIndex < m_objectList.Count)
{
// an allocated object is already available; just reset it
T t = m_objectList[m_nextAvailableIndex];
m_nextAvailableIndex++;
if (m_resetAction != null)
m_resetAction(t);
return t;
}
else
{
// no allocated object is available
T t = new T();
m_objectList.Add(t);
m_nextAvailableIndex++;
if (m_onetimeInitAction != null)
m_onetimeInitAction(t);
return t;
}
}
public void ResetAll()
{
m_nextAvailableIndex = 0;
}
}
The changes to the original ObjectPool<T> class are substantial this time. Regarding the signature of the class, the Store() method is replaced by ResetAll(), which only needs to be called once when all allocated objects should go back into the pool. Inside the class, the Stack<T> has been replaced by a List<T> which keeps references to all allocated objects even while they're being used. We also keep track of the index of the most recently created-or-released object in the list. In that way, New() knows whether to create a new object or reset an existing one.
https://www.programmerinterview.com/index.php/data-structures/difference-between-stack-and-heap/
What’s the difference between a stack and a heap?
How do threads interact with the stack and the heap? How do the stack and heap work in multithreading?
|
|
In a multi-threaded application, each thread will have its own stack. But, all the different threads will share the heap. Because the different threads share the heap in a multi-threaded application, this also means that there has to be some coordination between the threads so that they don’t try to access and manipulate the same piece(s) of memory in the heap at the same time.
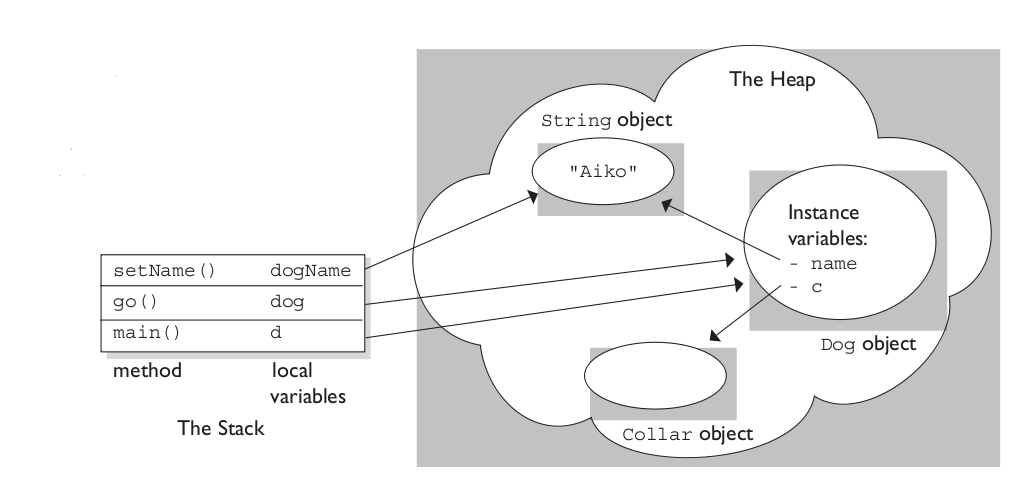
Can an object be stored on the stack instead of the heap?
Yes, an object can be stored on the stack. If you create an object inside a function without using the “new” operator then this will create and store the object on the stack, and not on the heap. Suppose we have a C++ class called Member, for which we want to create an object. We also have a function called somefunction( ). Here is what the code would look like:
Code to create an object on the stack:
void somefunction( )
{
/* create an object "m" of class Member
this will be put on the stack since the
"new" keyword is not used, and we are
creating the object inside a function
*/
Member m;
} //the object "m" is destroyed once the function ends
So, the object “m” is destroyed once the function has run to completion – or, in other words, when it “goes out of scope”. The memory being used for the object “m” on the stack will be removed once the function is done running.
If we want to create an object on the heap inside a function, then this is what the code would look like:
Code to create an object on the heap:
void somefunction( )
{
/* create an object "m" of class Member
this will be put on the heap since the
"new" keyword is used, and we are
creating the object inside a function
*/
Member* m = new Member( ) ;
/* the object "m" must be deleted
otherwise a memory leak occurs
*/
delete m;
}
In the code above, you can see that the “m” object is created inside a function using the “new” keyword. This means that “m” will be created on the heap. But, since “m” is created using the “new” keyword, that also means that we must delete the “m” object on our own as well – otherwise we will end up with a memory leak.
How long does memory on the stack last versus memory on the heap?
Once a function call runs to completion, any data on the stack created specifically for that function call will automatically be deleted. Any data on the heap will remain there until it’s manually deleted by the programmer.
Can the stack grow in size? Can the heap grow in size?
The stack is set to a fixed size, and can not grow past it’s fixed size (although some languages have extensions that do allow this). So, if there is not enough room on the stack to handle the memory being assigned to it, a stack overflow occurs. This often happens when a lot of nested functions are being called, or if there is an infinite recursive call.
If the current size of the heap is too small to accommodate new memory, then more memory can be added to the heap by the operating system. This is one of the big differences between the heap and the stack.
How are the stack and heap implemented?
The implementation really depends on the language, compiler, and run-time – the smalldetails of the implementation for a stack and a heap will always be different depending on what language and compiler are being used. But, in the big picture, the stacks and heaps in one language are used to accomplish the same things as stacks and heaps in another language.
Which is faster – the stack or the heap? And why?
The stack is much faster than the heap. This is because of the way that memory is allocated on the stack. Allocating memory on the stack is as simple as moving the stack pointer up.
How is memory deallocated on the stack and heap?
Data on the stack is automatically deallocated when variables go out of scope. However, in languages like C and C++, data stored on the heap has to be deleted manually by the programmer using one of the built in keywords like free, delete, or delete[ ]. Other languages like Java and .NET use garbage collection to automatically delete memory from the heap, without the programmer having to do anything..
What can go wrong with the stack and the heap?
If the stack runs out of memory, then this is called a stack overflow – and could cause the program to crash. The heap could have the problem of fragmentation, which occurs when the available memory on the heap is being stored as noncontiguous (or disconnected) blocks – because used blocks of memory are in between the unusedmemory blocks. When excessive fragmentation occurs, allocating new memory may be impossible because of the fact that even though there is enough memory for the desired allocation, there may not be enough memory in one big block for the desired amount of memory.
Which one should I use – the stack or the heap?
For people new to programming, it’s probably a good idea to use the stack since it’s easier.
Because the stack is small, you would want to use it when you know exactly how much memory you will need for your data, or if you know the size of your data is very small. It’s better to use the heap when you know that you will need a lot of memory for your data, or you just are not sure how much memory you will need (like with a dynamic array).