前言
什麼是ELK?
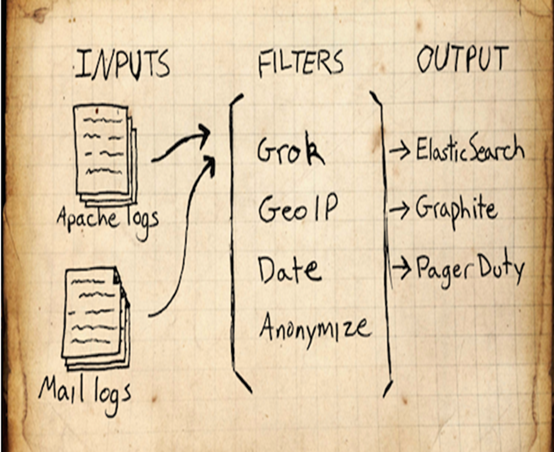
通俗來講,ELK是由Elasticsearch、Logstash、Kibana 三個開源軟件的組成的一個組合體,這三個軟件當中,每個軟件用於完成不同的功能,ELK 又稱爲ELK stack,官方域名爲stactic.co,ELK stack的主要優點有如下幾個:
處理方式靈活: elasticsearch是實時全文索引,具有強大的搜索功能
配置相對簡單:elasticsearch全部使用JSON 接口,logstash使用模塊配置,kibana的配置文件部分更簡單。
檢索性能高效:基於優秀的設計,雖然每次查詢都是實時,但是也可以達到百億級數據的查詢秒級響應。
集羣線性擴展:elasticsearch和logstash都可以靈活線性擴展
前端操作絢麗:kibana的前端設計比較絢麗,而且操作簡單
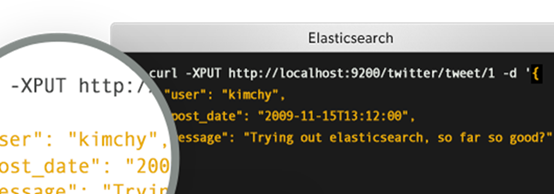
什麼是Elasticsearch:
是一個高度可擴展的開源全文搜索和分析引擎,它可實現數據的實時全文搜索搜索、支持分佈式可實現高可用、提供API接口,可以處理大規模日誌數據,比如Nginx、Tomcat、系統日誌等功能
什麼是Logstash:
可以通過插件實現日誌收集和轉發,支持日誌過濾,支持普通log、自定義json格式的日誌解析。
什麼是kibana:
主要是通過接口調用elasticsearch的數據,並進行前端數據可視化的展現。
一、elasticsearch部署:
1、環境準備
| 服務版本 | IP地址 | 主機名 |
|---|---|---|
| elasticsearch-7.0.0-x86_64 | 10.201.1.121 | linux-host1.exmaple.com |
| elasticsearch-7.0.0-x86_64 | 10.201.1.122 | linux-host2.exmaple.com |
- 關閉防所有服務器的火牆和selinux
systemctl  disable  firewalld
systemctl  disable  NetworkManager
sed -i '/SELINUX/s/enforcing/disabled/' /etc/selinux/config
echo "* soft nofile 65536" >> /etc/security/limits.conf
echo "* hard nofile 65536" >> /etc/security/limits.conf- 設置epel源、安裝基本操作命令並同步時間:
[root@linux-host1 ~]# wget -O /etc/yum.repos.d/epel.repo http://mirrors.aliyun.com/repo/epel-7.repo
[root@linux-host1 ~]# yum install -y net-tools vim lrzsz tree screen lsof tcpdump wget ntpdate
[root@linux-host1 ~]# cp /usr/share/zoneinfo/Asia/Shanghai  /etc/localtime
[root@linux-host1 ~]# echo "*/5 * * * *  ntpdate time1.aliyun.com &> /dev/null && hwclock -w" >> /var/spool/cron/root
[root@linux-host1 ~]# systemctl  restart crond
[root@linux-host1 ~]# reboot - 在兩臺服務器準備java環境:
下載二進制包自定義profile環境變量:
下載地址:http://www.oracle.com/technetwork/java/javase/downloads/jdk8-downloads-2133151.html
[root@linux-host1 ~]# tar xvf jdk-8u121-linux-x64.tar.gz  -C /usr/local/
[root@linux-host1 ~]# ln -sv /usr/local/jdk1.8.0_121 /usr/local/jdk
[root@linux-host1 ~]# vim /etc/profile
export HISTTIMEFORMAT="%F %T `whoami` "
export JAVA_HOME=/usr/local/jdk
export CLASSPATH=.:$JAVA_HOME/jre/lib/rt.jar:$JAVA_HOME/lib/dt.jar:$JAVA_HOME/lib/tools.jar
export PATH=$PATH:$JAVA_HOME/bin
[root@linux-host1 ~]# source  /etc/profile
[root@linux-host1 ~]# java -version
java version "1.8.0_121" #確認可以出現當前的java版本號
Java(TM) SE Runtime Environment (build 1.8.0_121-b13)
Java HotSpot(TM) 64-Bit Server VM (build 25.121-b13, mixed mode)
2、官網下載elasticsearch並安裝:
下載地址:https://www.elastic.co/cn/downloads/elasticsearch
rpm -ivh elk/elasticsearch-7.0.0-x86_64.rpm- 編輯各elasticsearch服務器的服務配置文件
[root@linux-host1 elk]# grep '^[a-Z]' /etc/elasticsearch/elasticsearch.yml
cluster.name: hkstv
node.name: node-1
path.data: /var/lib/elasticsearch
path.logs: /var/log/elasticsearch
network.host: 0.0.0.0
http.port: 9200
discovery.seed_hosts: ["10.201.1.121", "10.201.1.122"]
cluster.initial_master_nodes: ["10.201.1.121", "10.201.1.122"]
[root@linux-host2 ~]# grep '^[a-Z]' /etc/elasticsearch/elasticsearch.yml
cluster.name: hkstv
node.name: node-2
path.data: /var/lib/elasticsearch
path.logs: /var/log/elasticsearch
network.host: 0.0.0.0
http.port: 9200
discovery.seed_hosts: ["10.201.1.121", "10.201.1.122"]
cluster.initial_master_nodes: ["10.201.1.121", "10.201.1.122"]- 啓動elasticsearch服務並驗證:
systemctl restart elasticsearch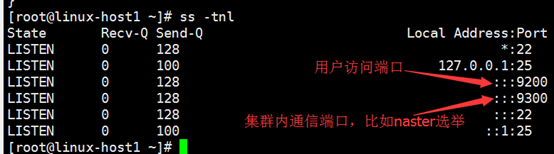
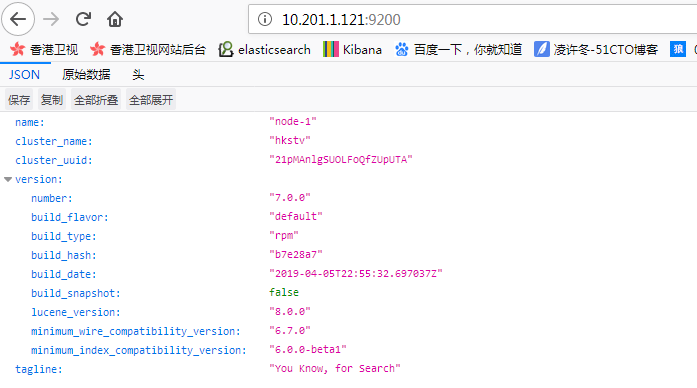
- 通過瀏覽器訪問elasticsearch服務端口
3、安裝elasticsearch插件之head:(兩臺其中一臺安裝即可)
插件是爲了完成不同的功能,官方提供了一些插件但大部分是收費的,另外也有一些開發愛好者提供的插件,可以實現對elasticsearch集羣的狀態監控與管理配置等功能。
Elasticsearch7.0不能使用命令直接安裝head插件
- 修改配置文件/etc/elasticsearch/elasticsearch.yml增加參數
# 增加參數,使head插件可以訪問es
http.cors.enabled: true
http.cors.allow-origin: "*"- 下載head插件 解壓至/opt目錄下
wget https://github.com/mobz/elasticsearch-head/archive/master.zip- 安裝node
wget https://npm.taobao.org/mirrors/node/latest-v4.x/node-v4.4.7-linux-x64.tar.gz
tar -zxvf node-v4.4.7-linux-x64.tar.gz- 修改環境變量/etc/profile添加
export NODE_HOME=/opt/node-v4.4.7-linux-x64
export PATH=$PATH:$NODE_HOME/bin
export NODE_PATH=$NODE_HOME/lib/node_modules- 設置生效
source /etc/profile- 安裝grunt
cd /opt/elasticsearch-head-master
npm install -g grunt-cli - 修改head插件源碼/opt/elasticsearch-head-master/Gruntfile.js
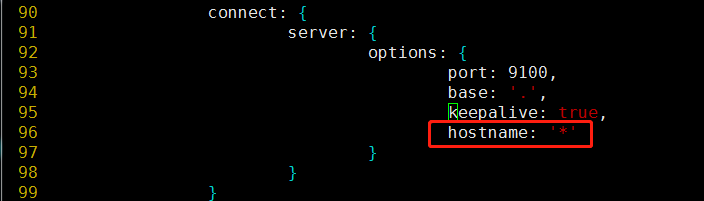
PS:hostname是新增的,不要忘記原有的true後面加,符號
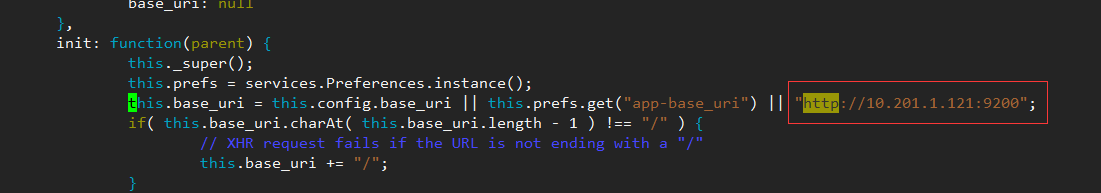
- 修改連接地址/opt/elasticsearch-head-master/_site/app.js
- 下載運行head必要的文件(放置在文件夾/tmp下)
cd /tmp
wget https://github.com/Medium/phantomjs/releases/download/v2.1.1/phantomjs-2.1.1-linux-x86_64.tar.bz2
yum -y install bzip2- 運行head
cd /opt/elasticsearch-head-master
npm install - 後臺啓動
grunt server &
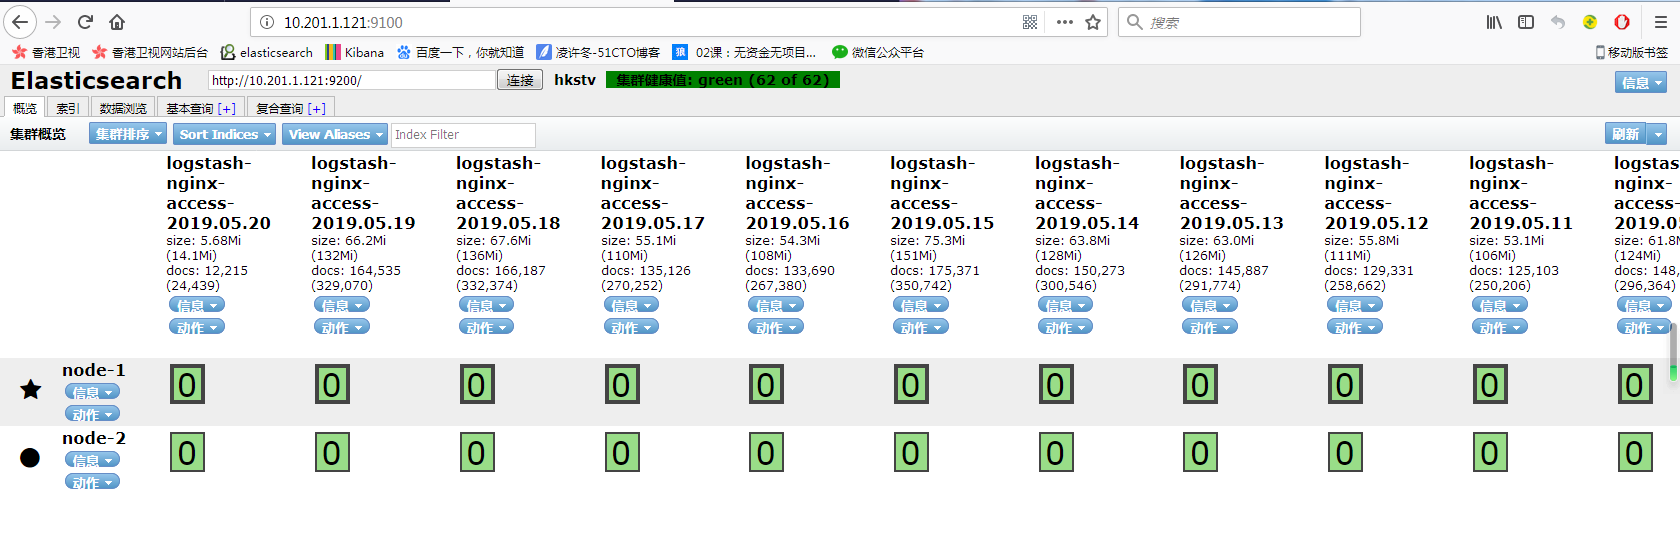
- web頁面驗證
- Master與Slave的區別:
Master的職責:
統計各node節點狀態信息、集羣狀態信息統計、索引的創建和刪除、索引分配的管理、關閉node節點等
Slave的職責:
同步數據、等待機會成爲Master
4、監控elasticsearch集羣狀態:
- 通過shell命令獲取集羣狀態:
[root@linux-host1 elk]# curl -sXGET http://10.201.1.121:9200/_cluster/health?pretty=true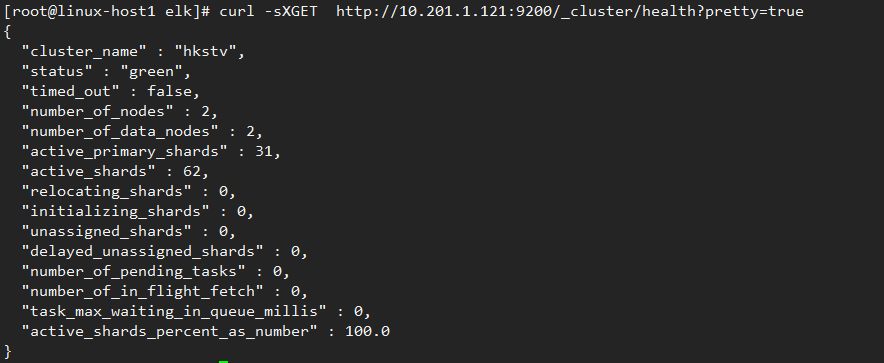
#獲取到的是一個json格式的返回值,那就可以通過python對其中的信息進行分析,例如對status進行分析,如果等於green(綠色)就是運行在正常,等於yellow(×××)表示副本分片丟失,red(紅色)表示主分片丟失
- python腳本
[root@linux-host1 ~]# cat els-cluster-monitor.py
#!/usr/bin/env python
#coding:utf-8

import smtplib
from email.mime.text import MIMEText
from email.utils import formataddr
import subprocess
body = ""
false="false"
obj = subprocess.Popen(("curl -sXGET http://10.201.1.121:9200/_cluster/health?pretty=true"),shell=True, stdout=subprocess.PIPE)
data =  obj.stdout.read()
data1 = eval(data)
status = data1.get("status")
if status == "green":
    print "50"
else:
    print "100"
- 腳本執行結果:
[root@linux-host1 ~]# python els-cluster-monitor.py
50
二、部署logstash:
1、環境準備
| 服務版本 | IP地址 | 主機名 |
|---|---|---|
| logstash-7.0.0 | 10.201.1.123 | linux-host3.exmaple.com |
關閉防火牆和selinux,並且安裝java環境
[root@linux-host3 ~]# systemctl  stop firewalld
[root@linux-host3 ~]# systemctl  disable  firewalld
[root@linux-host3 ~]# sed -i '/SELINUX/s/enforcing/disabled/' /etc/selinux/config
[root@linux-host3 ~]# yum install  jdk-8u121-linux-x64.rpm
[root@linux-host3 ~]# java -version
java version "1.8.0_121"
Java(TM) SE Runtime Environment (build 1.8.0_121-b13)
Java HotSpot(TM) 64-Bit Server VM (build 25.121-b13, mixed mode)
[root@linux-host3 ~]# reboot
2、安裝logstash:
rpm -ivh logstash-7.0.0.rpm 三、部署kibana:
Kibana是一個通過調用elasticsearch服務器進行圖形化展示搜索結果的開源項目。
| 服務版本 | IP地址 | 主機名 |
|---|---|---|
| kibana-7.0.0 | 10.201.1.122 | linux-host2.exmaple.com |
- 安裝kibana
rpm -ivh kibana-7.0.0-x86_64.rpm- 配置kibana
[root@linux-host2 ~]#  grep  "^[a-Z]" /etc/kibana/kibana.yml
server.port: 5601
server.host: "0.0.0.0"
elasticsearch.hosts: ["http://10.201.1.121:9200"]- 啓動kibana服務並驗證:
systemctl  start kibana
systemctl  enable  kibana
ss -tnl | grep 5601- 查看狀態:
http://10.201.1.122:5601/status

四、收集官網nginx的訪問日誌
nginx服務器地址:10.201.1.8
- 收集流程
在10.201.1.8服務器上安裝filebeat,通過配置filebeat來收集access.log,同時將收集到的日誌輸出到redis上,redis服務器地址爲10.201.1.124
然後10.201.1.123上的logstash收集redis中存放的日誌,將日誌存放到els中,最終通過配置kibana實現業務展示
1、在10.201.1.8上安裝filebeat
rpm -ivh filebeat-7.0.0-x86_64.rpm- 設置nginx日誌格式
  log_format  json '{"user_ip":"$http_x_real_ip","lan_ip":"$remote_addr","log_time":"$time_iso8601","user_req":"$request","http_code":"$status","body_bytes_sent":"$body_bytes_sent","req_time":"$request_time","user_ua":"$http_user_agent"}';
access_log /var/log/nginx/access.log json;- 配置filebeat
cat /etc/filebeat/filebeat.yml
filebeat.inputs:
- type: log
  enabled: true
  paths:
    - /var/log/nginx/access.log
  exclude_lines: ['10.201.1.36', '10.201.1.37', 'png', 'PlayDuration', '127.0.0.1', 'jpg', 'js', 'css', 'POST', 'skin']
  include_lines: ['html', 'tpl']
filebeat.config.modules:
  path: ${path.config}/modules.d/*.yml
  reload.enabled: false
setup.template.settings:
  index.number_of_shards: 1
setup.kibana:
output.redis:
  hosts: ["10.201.1.124:6379"]
  key: "nginx-log"
  db: 0
  timeout: 5
processors:
  - add_host_metadata: ~
- add_cloud_metadata: ~- 啓動filebeat
systemctl start filebeat- 驗證redis是否有數據
[root@linux-host4 ~]# redis-cli localhost
10.201.1.124:6379> keys *
1) "nginx-log"
2、10.201.1.123上的logstash收集日誌
- 通過地圖統計客戶IP所在城市
cd /etc/logstash/
wget http://geolite.maxmind.com/download/geoip/database/GeoLite2-City.tar.gz
gunzip  GeoLite2-City.tar.gz
tar xf GeoLite2-City.tar
配置logstash使用地址庫
其中elasticsearch 的索引名稱必須必須必須以logstash-開頭。- 配置收集規則
[root@linux-host3 elk]# cat /etc/logstash/conf.d/1.conf
input{
redis {
    host => "10.201.1.124"
    port => "6379"
    db => "0"
    key => "nginx-log"
    data_type => "list"
 }

}
filter{

json {
        source => "message"
        remove_field => ["tags","beat","message"]
    }
useragent {
source =>"user_ua"
target =>"userAgent"
}
geoip {
                source => "lan_ip"
                target => "geoip"
                database => "/etc/logstash/GeoLite2-City_20190430/GeoLite2-City.mmdb"
                add_field => [ "[geoip][coordinates]", "%{[geoip][longitude]}" ]
                add_field => [ "[geoip][coordinates]", "%{[geoip][latitude]}"  ]
                remove_field => ["[geoip][latitude]", "[geoip][longitude]", "[geoip][country_code]", "[geoip][country_code2]", "[geoip][country_code3]", "[geoip][timezone]", "[geoip][continent_code]", "[geoip][region_code]"]
        }
    mutate {
      convert => [ "[geoip][coordinates]", "float"]
      convert => [ "req_time","integer" ]
      convert => [ "body_bytes_sent","integer" ]
      remove_field => "timestamp"
      remove_field => "version"
      remove_field => "offset"
      remove_field => "user_ip"
    }

}
output{
    elasticsearch {
            hosts => ["10.201.1.121:9200"]
            index => "logstash-nginx-access-%{+YYYY.MM.dd}"
        }
}
- 重啓logstash
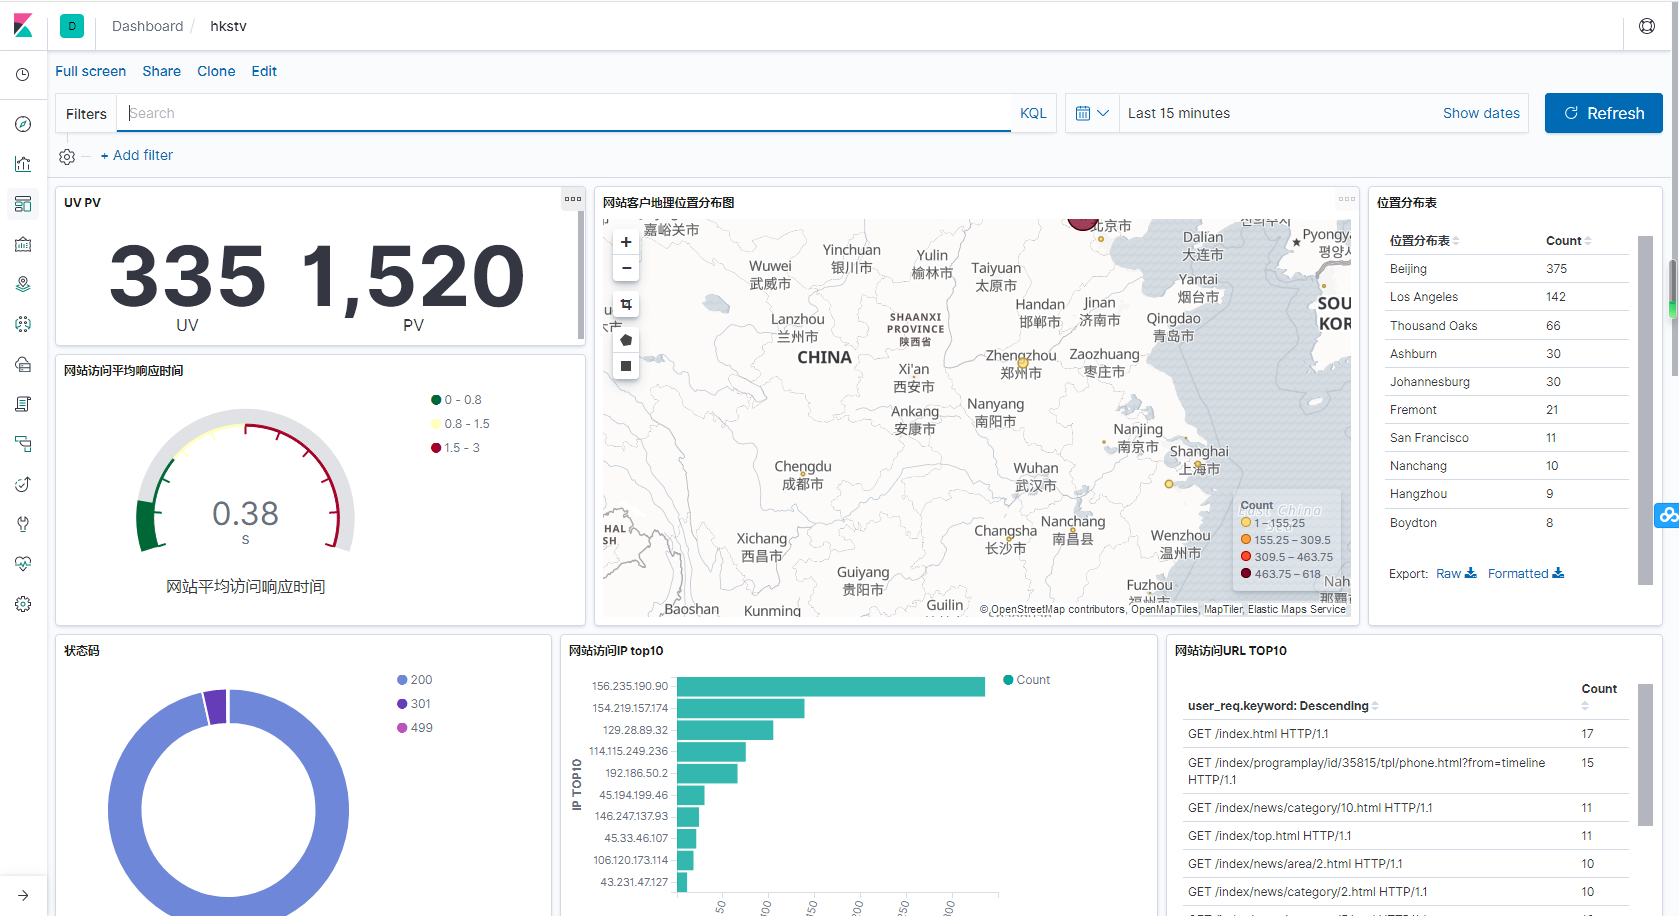
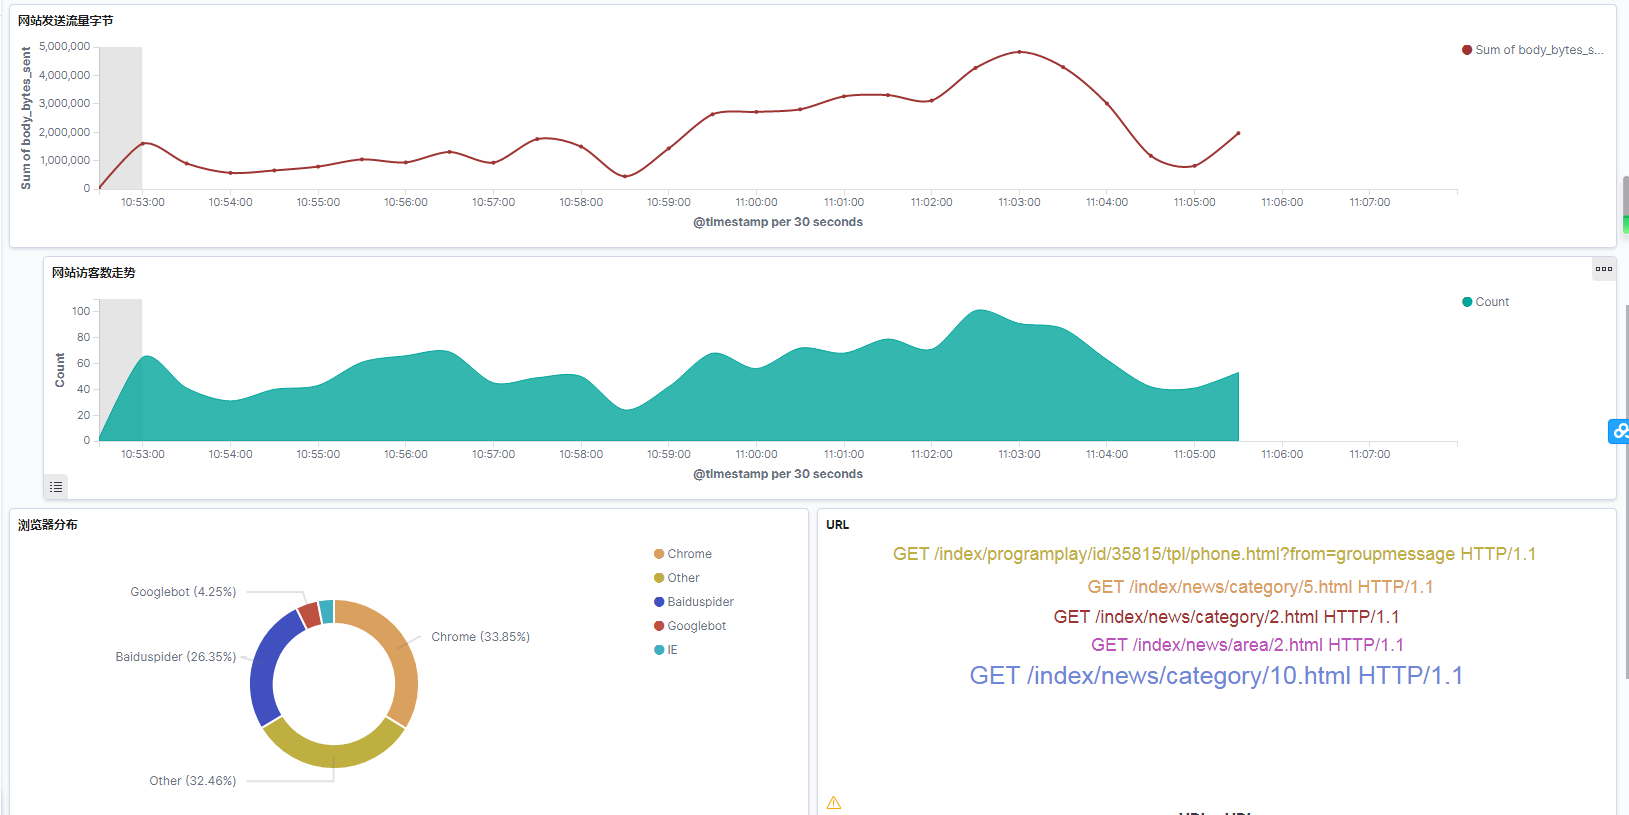
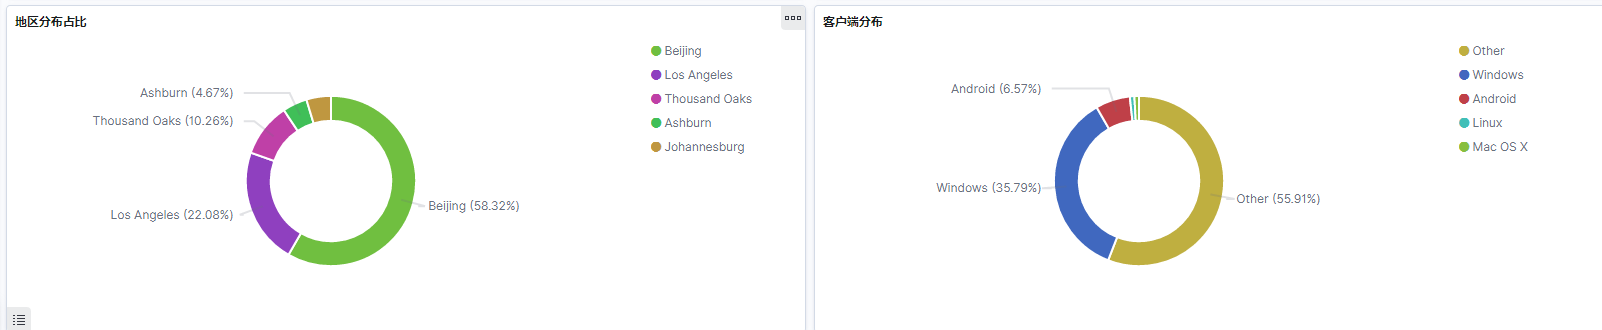
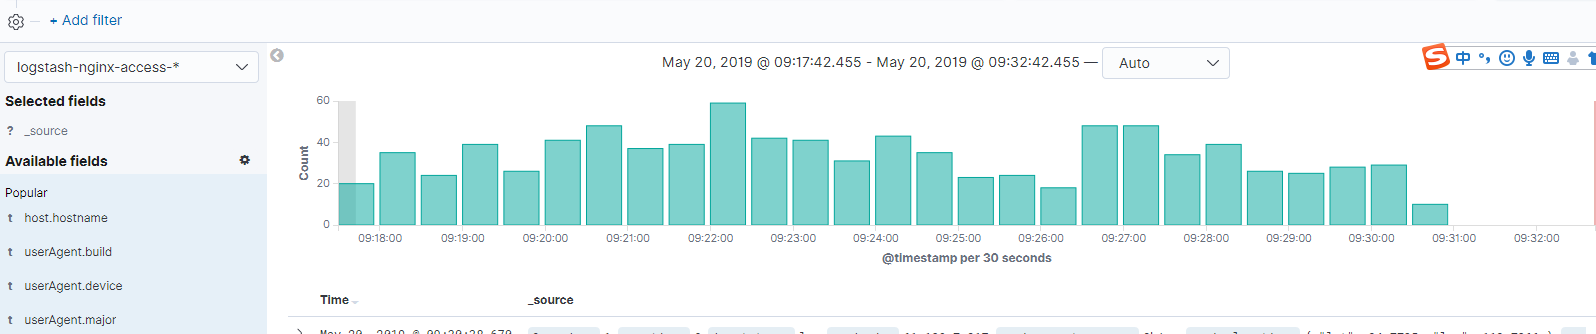
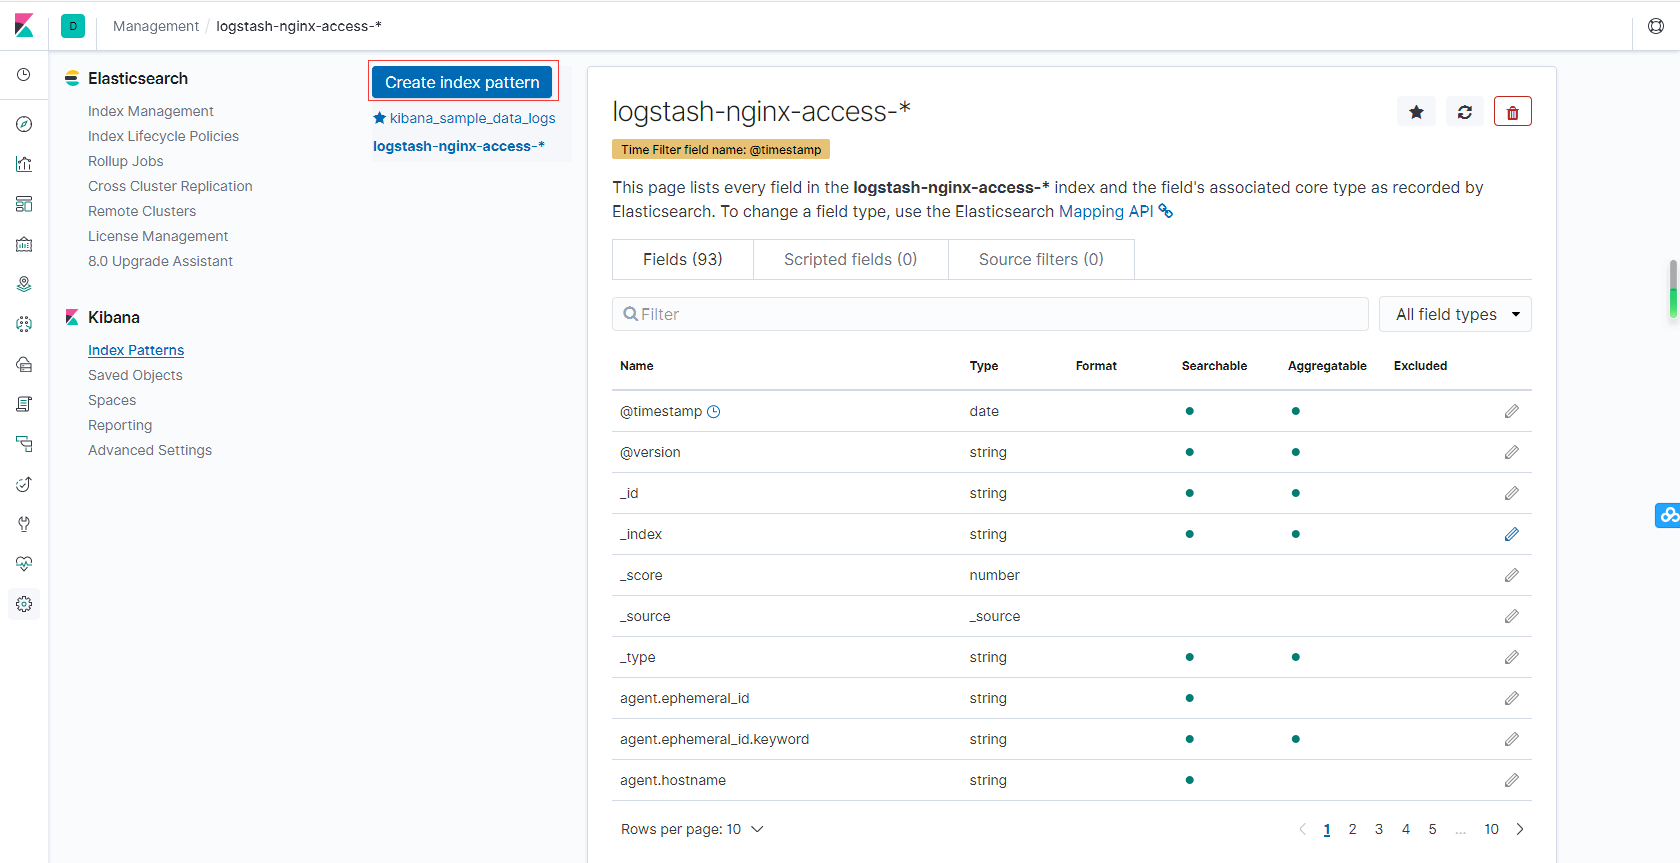
systemctl restart logstash3、kibana展示
- 創建索引
- 展示收集的日誌
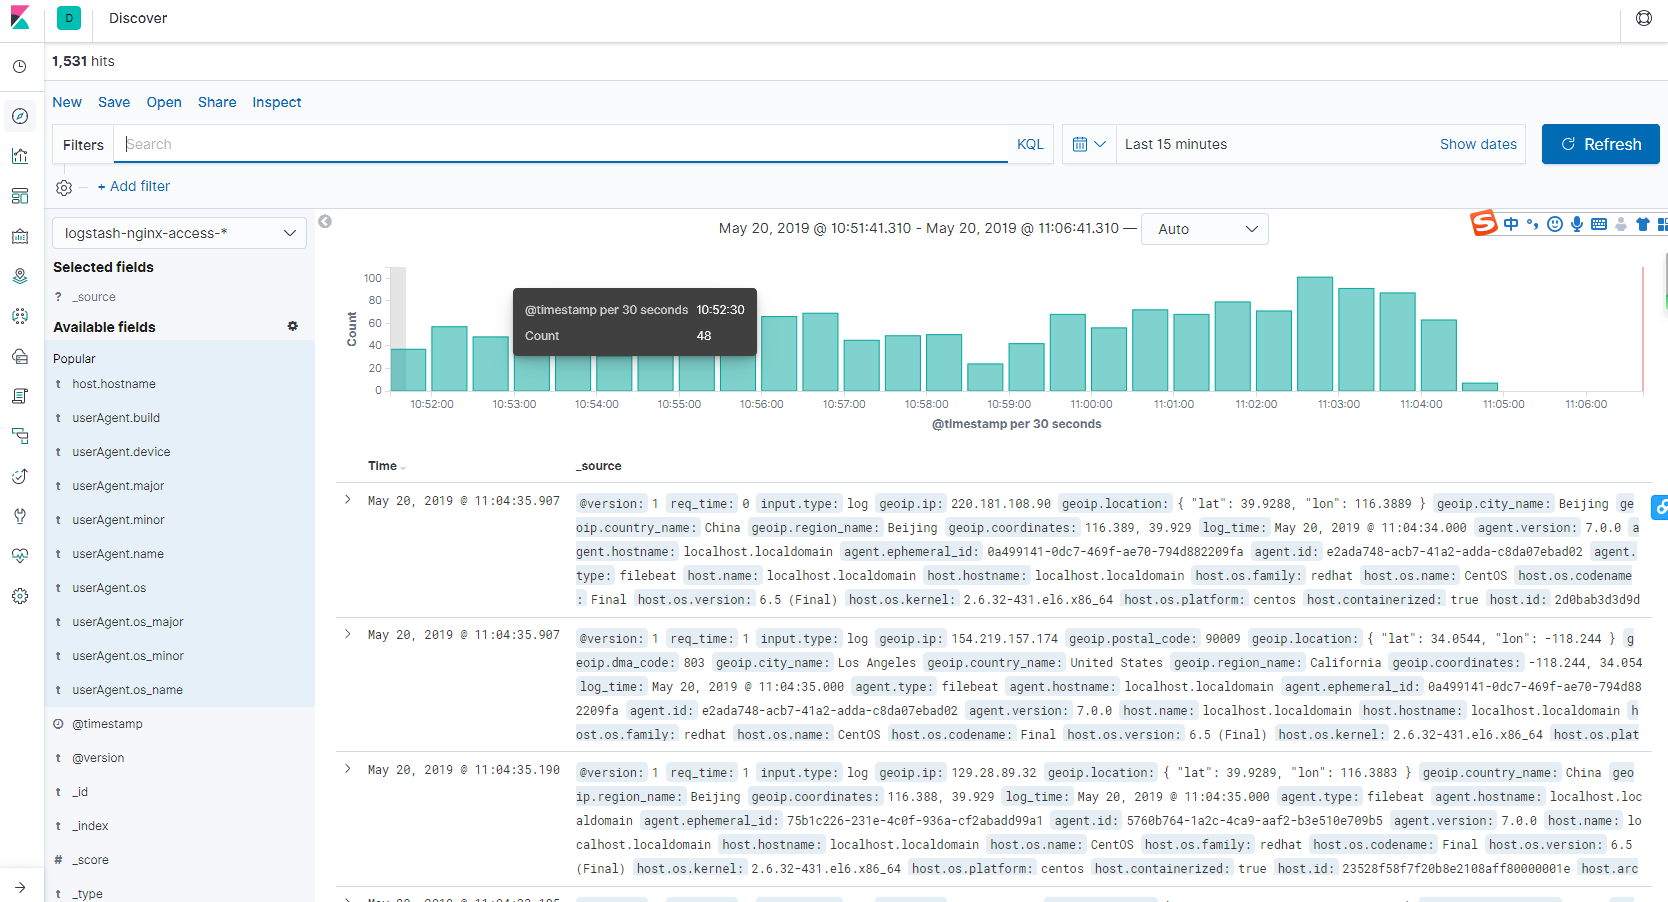
- 定義圖像,展示