


圖例控件
樣式選項卡
可以通過圖表編輯器,圖表選項卡,圖例頁面訪問圖例參數。
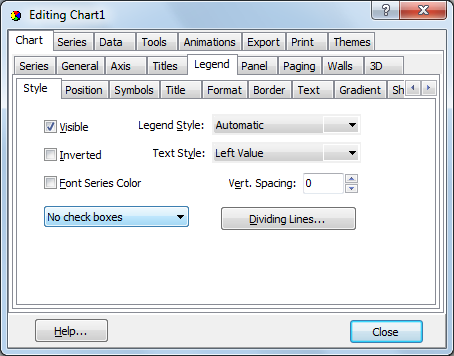
圖例樣式
圖例默認樣式“自動”將在圖表中只有一個系列時將系列點值放入圖例中。當圖表包含多個系列時,“自動”會將系列名稱放入圖例中。在編輯器中,使用Dropdown Combobox獲取默認值以外的值。如果更改圖例樣式以顯示值,並且圖表中有多個系列,TeeChart Pro將顯示第一個系列的值。您可以使用自定義選項修改顯示。
Chart1.Legend.LegendStyle := lsLastValues;

//Puts the last value of each Series in the Legend box
文本樣式
有關可能的圖例文本樣式的列表,請參閱TextStyle屬性。文本樣式格式化圖例中的系列條目(例如,將值顯示爲總計的百分比等)。
定位圖例(位置選項卡選項)
對齊
使用對齊屬性(頂部,底部,左側和右側)有4個可用的默認位置。右邊是默認位置。圖例的默認定位始終位於圖表之外。有關定位圖例的詳細信息,請參閱有關自定義圖例的部分。
調整圖表
大小調整大小圖表屬性,如果未啓用,將在圖表框架區域內繪製圖例。雖然這對於某些Legend定位要求可能是令人滿意的,但是通過使用Legend HorizMargin和VertMargin屬性可以更好地控制與Chart框架相關的Legend定位。
HorizMargin和VertMargin
Horizmargin適用於左右對齊的圖例。VertMargin適用於頂部和底部對齊的圖例。更改Horizmargin屬性值將移動Chart框架相對於Legend,反之亦然。因此,將Horizmargin值設爲負值會將圖表移動到圖例上(增加圖表矩形區域的大小)。但是,這些屬性不適用於在圖表上重新定位圖例,爲實現此目的,最好使用運行時自定義圖例內容中概述的技術。
自定義位置
將Legend CustomPosition屬性設置爲true,然後將Legend的Top和Left像素座標設置爲自定義位置。
 With Chart1.Legend do
  Begin
    CustomPosition:=True;
    Top:=100;
    Left:=100;
  end;
水平圖例中的行數
圖例水平對齊(頂部或底部)時,可以指定行數:
Chart1.Legend.MaxNumRows:=3;
默認情況下,MaxNumRows爲0(零),這意味着Legend將根據需要使用儘可能多的行顯示所有值。
顏色框修改(編輯器的符號選項卡)
使用Colorwidth屬性設置圖例中顏色框的寬度。
With Chart1.Legend do
  Begin
    //move the colour boxes to the right of the value list
    Symbol.Position:=spRight;

    //set the boxes as continuous
    Symbol.Continuous:=True;

    //Make the boxes wider
    Colorwidth:=40;
  end;

  //Hide the Pen of the line between the boxes
  //The line depends on the Series itself (here a Line Series)

  Series1.LinePen.Visible:=False;
在運行時自定義圖例內容
Legend事件提供完全控制Legend外觀和內容的選項。
OnGetLegendRect事件
圖例外部矩形允許更改“圖例”框的整體大小和位置。與OnGetLegendPos結合使用以重新定位圖表圖例和內容。
例如。您可以使用CustomPosition更無縫地實現以下移動(請參閱上文)
procedure TForm1.Chart1GetLegendRect(Sender: TCustomChart; var Rect: TRect);
begin
  //This moves the Legend box to the left (leaving the contents where they were !)
  //Set Chart1.Legend.ResizeChart := False; to disable resizing of the Chart
  //thus placing the Legend inside the Chart rectangle
  Rect.Left := Rect.Left - 100;
  Rect.Right := Rect.Right - 100;
end;
OnGetLegendPos事件
修改圖例內容的位置。以下示例可與上面的代碼一起使用,將Legend內容移動到新的Legend矩形。
procedure TForm1.Chart1GetLegendPos(Sender: TCustomChart; Index: Integer;
  var X, Y, XColor: Integer);
begin
  //Moves the Legend contents to the left by 100 pixels use with OnGetLegendRect
  //Does not move colour boxes.
  X := X - 100;
end;
OnGetLegendText事件
修改圖例內容的文本。
procedure TForm1.Chart1GetLegendText(Sender: TCustomAxisPanel;
  LegendStyle: TLegendStyle; Index: Integer; var LegendText: String);
begin
  //Modify Legend text
  LegendText := LegendText + IntToStr(Index);
end;
將圖例放置在圖表矩形區域內時,請記住圖例在系列和軸之前繪製,並且將出現在任何交叉點的任何一個下方。
OnClickLegend事件
單擊圖例時拾取圖例項目。
procedure TForm1.Chart1ClickLegend(Sender: TCustomChart;
  Button: TMouseButton; Shift: TShiftState; X, Y: Integer);
Var tmp:Integer;
begin
  tmp:=Chart1.Legend.Clicked( x,y ) ;

  if tmp<>-1 then
     ShowMessage( 'Clicked legend item: '+ Chart1.FormattedLegend( tmp ) );
end;