


一、介紹
1、分析SQL執行帶來的開銷是優化SQL的重要手段。
2、在MySQL數據庫中,可以通過配置profiling參數來啓用SQL剖析。
3、該參數可以在全局和session級別來設置。
4、對於全局級別則作用於整個MySQL實例,而session級別緊影響當前session。
5、該參數開啓後,後續執行的SQL語句都將記錄其資源開銷,諸如IO,上下文切換,CPU,Memory等等。根據這些開銷進一步分析當前SQL瓶頸從而進行優化與調整。
二、有關profile的描述show variables like 'version';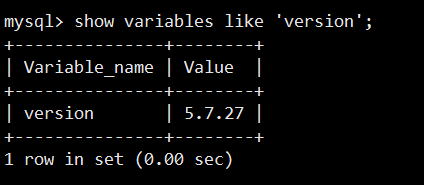
show variables like '%profil%';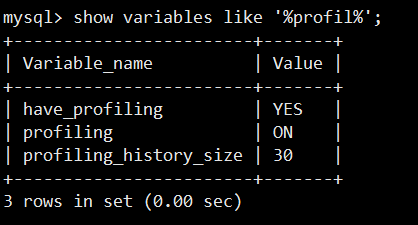
mysql> show variables like '%profil%';
+------------------------+-------+
| Variable_name          | Value |
+------------------------+-------+
| have_profiling         | YES   |          --只讀變量,用於控制是否由系統變量開啓或禁用profiling
| profiling              | OFF   |               --開啓SQL語句剖析功能
| profiling_history_size | 15    |          --設置保留profiling的數目,缺省爲15,範圍爲0至100,爲0時將禁
+------------------------+-------+
3 rows in set (0.00 sec)
--獲取profile的幫助
root@localhost[sakila]> help profile;
Name: 'SHOW PROFILE'
Description:
Syntax:
SHOW PROFILE [type [, type] ... ]
[FOR QUERY n]
[LIMIT row_count [OFFSET offset]]
type:
ALL --顯示所有的開銷信息
| BLOCK IO --顯示塊IO相關開銷
| CONTEXT SWITCHES --上下文切換相關開銷
| CPU --顯示CPU相關開銷信息
| IPC --顯示發送和接收相關開銷信息
| MEMORY --顯示內存相關開銷信息
| PAGE FAULTS --顯示頁面錯誤相關開銷信息
| SOURCE --顯示和Source_function,Source_file,Source_line相關的開銷信息
| SWAPS --顯示交換次數相關開銷的信息
2、開啓porfiling --啓用session級別的profiling
root@localhost[sakila]> set profiling=1;
Query OK, 0 rows affected, 1 warning (0.00 sec)
--驗證修改後的結果
root@localhost[sakila]> show variables like '%profil%';
+------------------------+-------+
| Variable_name | Value |
+------------------------+-------+
| have_profiling | YES |
| profiling | ON |
| profiling_history_size | 15 |
+------------------------+-------+
--發佈SQL查詢
root@localhost[sakila]> select count(*) from customer;
+----------+
| count(*) |
+----------+
| 599 |
+----------+
--查看當前session所有已產生的profile
root@localhost[sakila]> show profiles;
+----------+------------+--------------------------------+
| Query_ID | Duration | Query |
+----------+------------+--------------------------------+
| 1 | 0.00253600 | show variables like '%profil%' |
| 2 | 0.00138150 | select count(*) from customer |
+----------+------------+--------------------------------+
2 rows in set, 1 warning (0.01 sec)
--我們看到有2個warning,之前一個,現在一個
root@localhost[sakila]> show warnings; --下面的結果表明SHOW PROFILES將來會被Performance Schema替換掉
+---------+------+--------------------------------------------------------------------------------------------------------------+
| Level | Code | Message |
+---------+------+--------------------------------------------------------------------------------------------------------------+
| Warning | 1287 | 'SHOW PROFILES' is deprecated and will be removed in a future release. Please use Performance Schema instead |
+---------+------+--------------------------------------------------------------------------------------------------------------+ 3、獲取SQL語句的開銷信息
--可以直接使用show profile來查看上一條SQL語句的開銷信息
--注,show profile之類的語句不會被profiling,即自身不會產生Profiling
--我們下面的這個show profile查看的是show warnings產生的相應開銷
root@localhost[sakila]> show profile;
+----------------+----------+
| Status         | Duration |
+----------------+----------+
| starting       | 0.000141 |
| query end      | 0.000058 |
| closing tables | 0.000014 |
| freeing items  | 0.001802 |
| cleaning up    | 0.000272 |
+----------------+----------+

--如下面的查詢show warnings被添加到profiles
root@localhost[sakila]> show profiles;
+----------+------------+--------------------------------+
| Query_ID | Duration   | Query                          |
+----------+------------+--------------------------------+
|        1 | 0.00253600 | show variables like '%profil%' |
|        2 | 0.00138150 | select count(*) from customer  |
|        3 | 0.00228600 | show warnings                  |
+----------+------------+--------------------------------+

--獲取指定查詢的開銷
root@localhost[sakila]> show profile for query 2;
+----------------------+----------+
| Status               | Duration |
+----------------------+----------+
| starting             | 0.000148 |
| checking permissions | 0.000014 |
| Opening tables       | 0.000047 |
| init                 | 0.000023 |
| System lock          | 0.000035 |
| optimizing           | 0.000012 |
| statistics           | 0.000019 |
| preparing            | 0.000014 |
| executing            | 0.000006 |
| Sending data         | 0.000990 |
| end                  | 0.000010 |
| query end            | 0.000011 |
| closing tables       | 0.000010 |
| freeing items        | 0.000016 |
| cleaning up          | 0.000029 |
+----------------------+----------+

--查看特定部分的開銷,如下爲CPU部分的開銷
root@localhost[sakila]> show profile cpu for query 2 ;
+----------------------+----------+----------+------------+
| Status               | Duration | CPU_user | CPU_system |
+----------------------+----------+----------+------------+
| starting             | 0.000148 | 0.000000 |   0.000000 |
| checking permissions | 0.000014 | 0.000000 |   0.000000 |
| Opening tables       | 0.000047 | 0.000000 |   0.000000 |
| init                 | 0.000023 | 0.000000 |   0.000000 |
| System lock          | 0.000035 | 0.000000 |   0.000000 |
| optimizing           | 0.000012 | 0.000000 |   0.000000 |
| statistics           | 0.000019 | 0.000000 |   0.000000 |
| preparing            | 0.000014 | 0.000000 |   0.000000 |
| executing            | 0.000006 | 0.000000 |   0.000000 |
| Sending data         | 0.000990 | 0.001000 |   0.000000 |
| end                  | 0.000010 | 0.000000 |   0.000000 |
| query end            | 0.000011 | 0.000000 |   0.000000 |
| closing tables       | 0.000010 | 0.000000 |   0.000000 |
| freeing items        | 0.000016 | 0.000000 |   0.000000 |
| cleaning up          | 0.000029 | 0.000000 |   0.000000 |
+----------------------+----------+----------+------------+

--如下爲MEMORY部分的開銷
root@localhost[sakila]> show profile memory for query 2 ;
+----------------------+----------+
| Status               | Duration |
+----------------------+----------+
| starting             | 0.000148 |
| checking permissions | 0.000014 |
| Opening tables       | 0.000047 |
| init                 | 0.000023 |
| System lock          | 0.000035 |
| optimizing           | 0.000012 |
| statistics           | 0.000019 |
| preparing            | 0.000014 |
| executing            | 0.000006 |
| Sending data         | 0.000990 |
| end                  | 0.000010 |
| query end            | 0.000011 |
| closing tables       | 0.000010 |
| freeing items        | 0.000016 |
| cleaning up          | 0.000029 |
+----------------------+----------+

--同時查看不同資源開銷
root@localhost[sakila]> show profile block io,cpu for query 2;
+----------------------+----------+----------+------------+--------------+---------------+
| Status               | Duration | CPU_user | CPU_system | Block_ops_in | Block_ops_out |
+----------------------+----------+----------+------------+--------------+---------------+
| starting             | 0.000148 | 0.000000 |   0.000000 |            0 |             0 |
| checking permissions | 0.000014 | 0.000000 |   0.000000 |            0 |             0 |
| Opening tables       | 0.000047 | 0.000000 |   0.000000 |            0 |             0 |
| init                 | 0.000023 | 0.000000 |   0.000000 |            0 |             0 |
| System lock          | 0.000035 | 0.000000 |   0.000000 |            0 |             0 |
| optimizing           | 0.000012 | 0.000000 |   0.000000 |            0 |             0 |
| statistics           | 0.000019 | 0.000000 |   0.000000 |            0 |             0 |
| preparing            | 0.000014 | 0.000000 |   0.000000 |            0 |             0 |
| executing            | 0.000006 | 0.000000 |   0.000000 |            0 |             0 |
| Sending data         | 0.000990 | 0.001000 |   0.000000 |            0 |             0 |
| end                  | 0.000010 | 0.000000 |   0.000000 |            0 |             0 |
| query end            | 0.000011 | 0.000000 |   0.000000 |            0 |             0 |
| closing tables       | 0.000010 | 0.000000 |   0.000000 |            0 |             0 |
| freeing items        | 0.000016 | 0.000000 |   0.000000 |            0 |             0 |
| cleaning up          | 0.000029 | 0.000000 |   0.000000 |            0 |             0 |
+----------------------+----------+----------+------------+--------------+---------------+

--下面的SQL語句用於查詢query_id爲2的SQL開銷,且按最大耗用時間倒序排列
root@localhost[sakila]> set @query_id=2;

root@localhost[sakila]> SELECT STATE, SUM(DURATION) AS Total_R,
    ->   ROUND(
    ->        100 * SUM(DURATION) /
    ->           (SELECT SUM(DURATION)
    ->            FROM INFORMATION_SCHEMA.PROFILING
    ->            WHERE QUERY_ID = @query_id
    ->        ), 2) AS Pct_R,
    ->     COUNT(*) AS Calls,
    ->     SUM(DURATION) / COUNT(*) AS "R/Call"
    ->  FROM INFORMATION_SCHEMA.PROFILING
    ->  WHERE QUERY_ID = @query_id
    ->  GROUP BY STATE
    ->  ORDER BY Total_R DESC;
+----------------------+----------+-------+-------+--------------+
| STATE                | Total_R  | Pct_R | Calls | R/Call       |
+----------------------+----------+-------+-------+--------------+
| Sending data         | 0.000990 | 71.53 |     1 | 0.0009900000 |--最大耗用時間部分爲發送數據
| starting             | 0.000148 | 10.69 |     1 | 0.0001480000 |
| Opening tables       | 0.000047 |  3.40 |     1 | 0.0000470000 |
| System lock          | 0.000035 |  2.53 |     1 | 0.0000350000 |
| cleaning up          | 0.000029 |  2.10 |     1 | 0.0000290000 |
| init                 | 0.000023 |  1.66 |     1 | 0.0000230000 |
| statistics           | 0.000019 |  1.37 |     1 | 0.0000190000 |
| freeing items        | 0.000016 |  1.16 |     1 | 0.0000160000 |
| preparing            | 0.000014 |  1.01 |     1 | 0.0000140000 |
| checking permissions | 0.000014 |  1.01 |     1 | 0.0000140000 |
| optimizing           | 0.000012 |  0.87 |     1 | 0.0000120000 |
| query end            | 0.000011 |  0.79 |     1 | 0.0000110000 |
| end                  | 0.000010 |  0.72 |     1 | 0.0000100000 |
| closing tables       | 0.000010 |  0.72 |     1 | 0.0000100000 |
| executing            | 0.000006 |  0.43 |     1 | 0.0000060000 |
+----------------------+----------+-------+-------+--------------+

--開啓profiling後,我們可以通過show profile等方式查看,其實質是這些開銷信息被記錄到information_schema.profiling表
--如下面的查詢,部分信息省略
profiling
root@localhost[information_schema]> select * from profiling limit 3,3\G;
*************************** 1. row ***************************
           QUERY_ID: 1
                SEQ: 5
              STATE: init
           DURATION: 0.000020
           CPU_USER: 0.000000
         CPU_SYSTEM: 0.000000
  CONTEXT_VOLUNTARY: 0
CONTEXT_INVOLUNTARY: 0
       BLOCK_OPS_IN: 0
      BLOCK_OPS_OUT: 0
      MESSAGES_SENT: 0
  MESSAGES_RECEIVED: 0
  PAGE_FAULTS_MAJOR: 0
  PAGE_FAULTS_MINOR: 0
              SWAPS: 0
    SOURCE_FUNCTION: mysql_prepare_select
        SOURCE_FILE: sql_select.cc
        SOURCE_LINE: 1050

--停止profile,可以設置profiling參數,或者在session退出之後,profiling會被自動關閉
root@localhost[sakila]> set profiling=off;
Query OK, 0 rows affected, 1 warning (0.00 sec)