在Ceph Luminous之前的版本,可以使用第三方的Prometheus exporterceph_exporter。 Ceph Luminous 12.2.1的mgr中自帶了Prometheus插件,內置了 Prometheus ceph exporter,可以使用Ceph mgr內置的exporter作爲Prometheus的target。
(1)環境介紹
shell> ceph -v
ceph version 14.2.4 nautilus (stable)
(2)環境準備
① grafana部署
shell> yum -y install grafana
shell> rpm -qa | grep grafana
grafana-6.3.6-1.x86_64
shell> netstat -tunlp | grep grafana #監聽3000端口
http://10.10.204.38:3000 默認密碼admin admin
② prometheus server 部署
查看該鏈接部署https://blog.51cto.com/7603402/2444837
(3)使用ceph mgr prometheus插件
①找到mgr active 主機
shell> ceph -s
mgr: admin(active, since 107m), standbys: node140
② 在ceph mgr admin節點上啓動插件
shell>ceph mgr module enable prometheus
③查看插件是否啓動
shell>netstat -nltp | grep mgr
tcp6 0 0 :::9283 :::* LISTEN 59954/ceph-mgr
④檢查是否已經獲取到數據
shell> curl 127.0.0.1:9283/metrics #可以看到大量的返回值
(4)配置prometheus server 添加ceph集羣 job
shell>vim prometheus.yml
#在scrape_configs: 配置項下添加,注意空格按yml 2 4 6 8 空格的規則
  - job_name: 'ceph_cluster'
    honor_labels: true
    scrape_interval: 5s
    static_configs:
      - targets: ['10.10.202.142:9283']
        labels:
          instance: ceph
① 重啓prometheus 服務
shell>systemctl restart prometheus
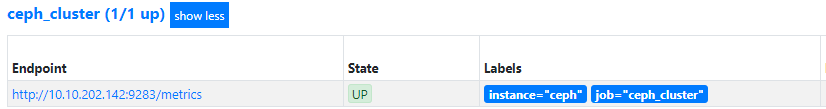
② 檢查prometheus服務器中是否添加成功
瀏覽器-》 http://x.x.x.x:9090 -》status -》Targets
(5)grafana添加展示
①瀏覽器登錄 grafana 管理界面
②添加data sources ,點擊configuration--》data sources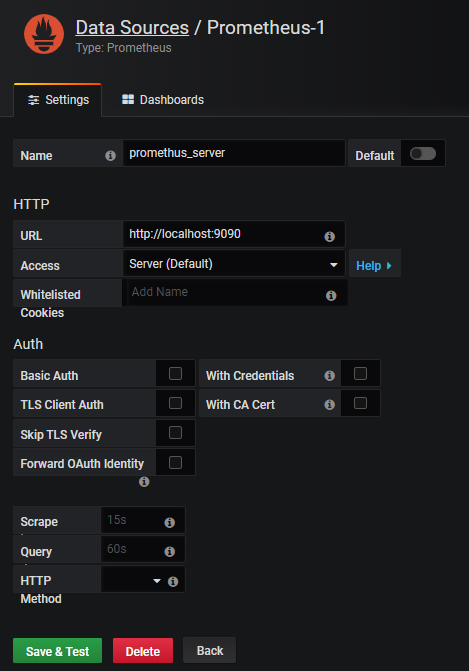
③ 添加dashboard
點擊HOME--》find dashboard on grafana.com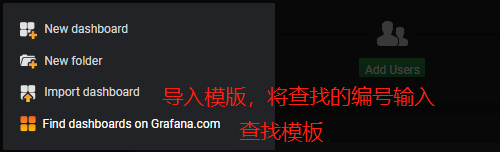
④ 搜索ceph的dashboard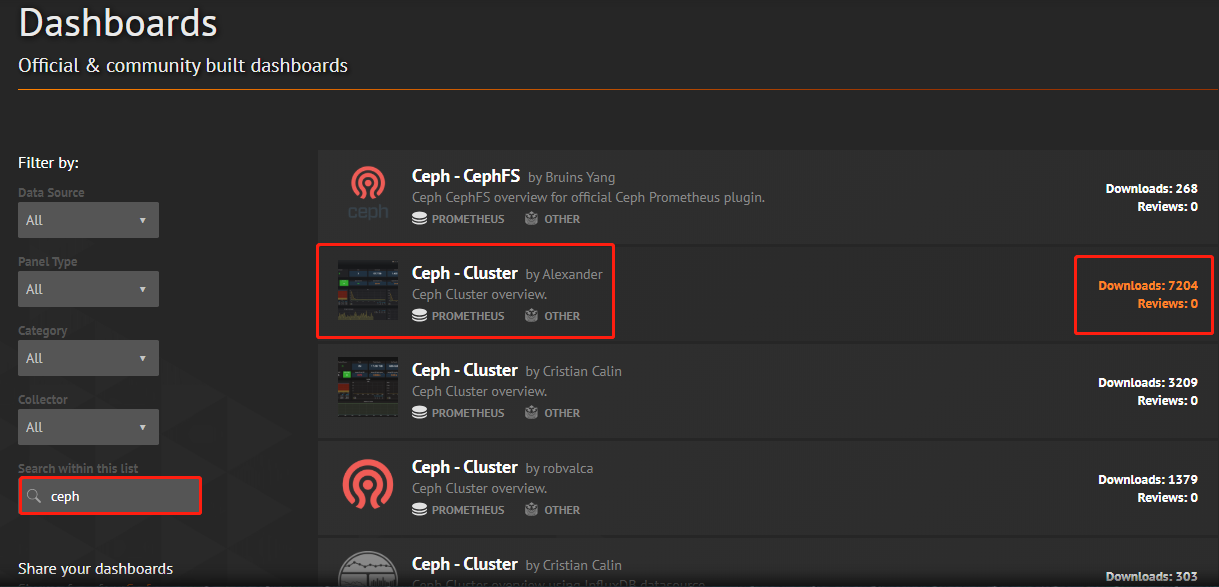
⑤ 選擇合適的dashboard,記錄編號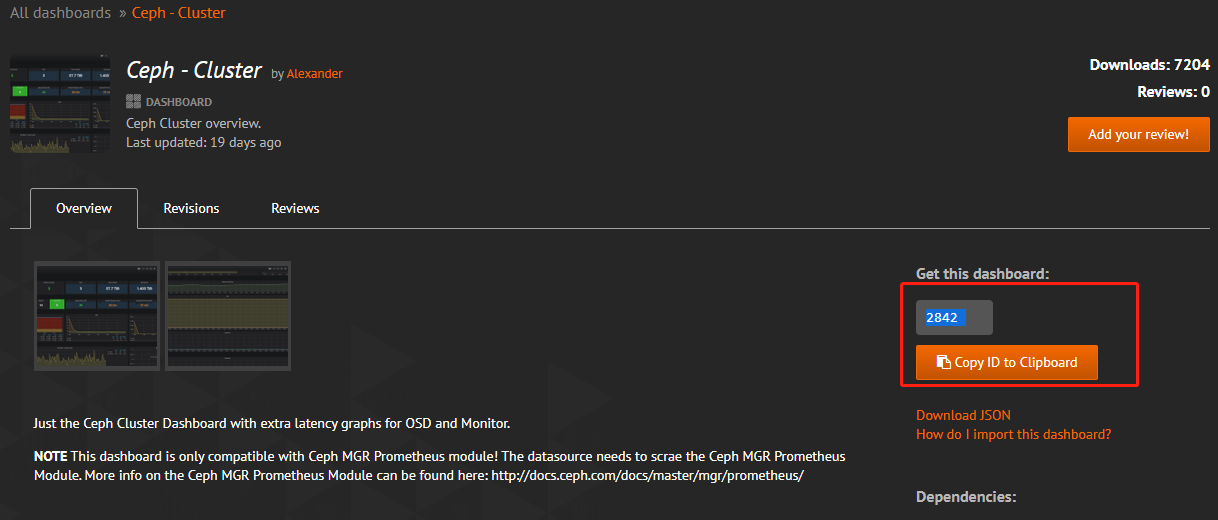
⑥ Import dashboard 再選導入模板,輸入編號
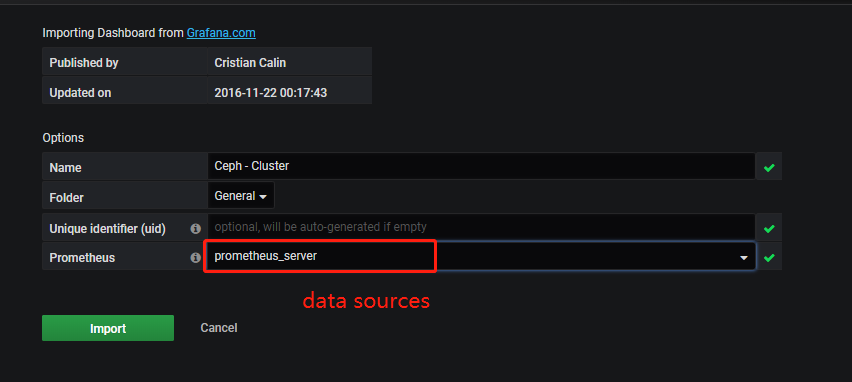
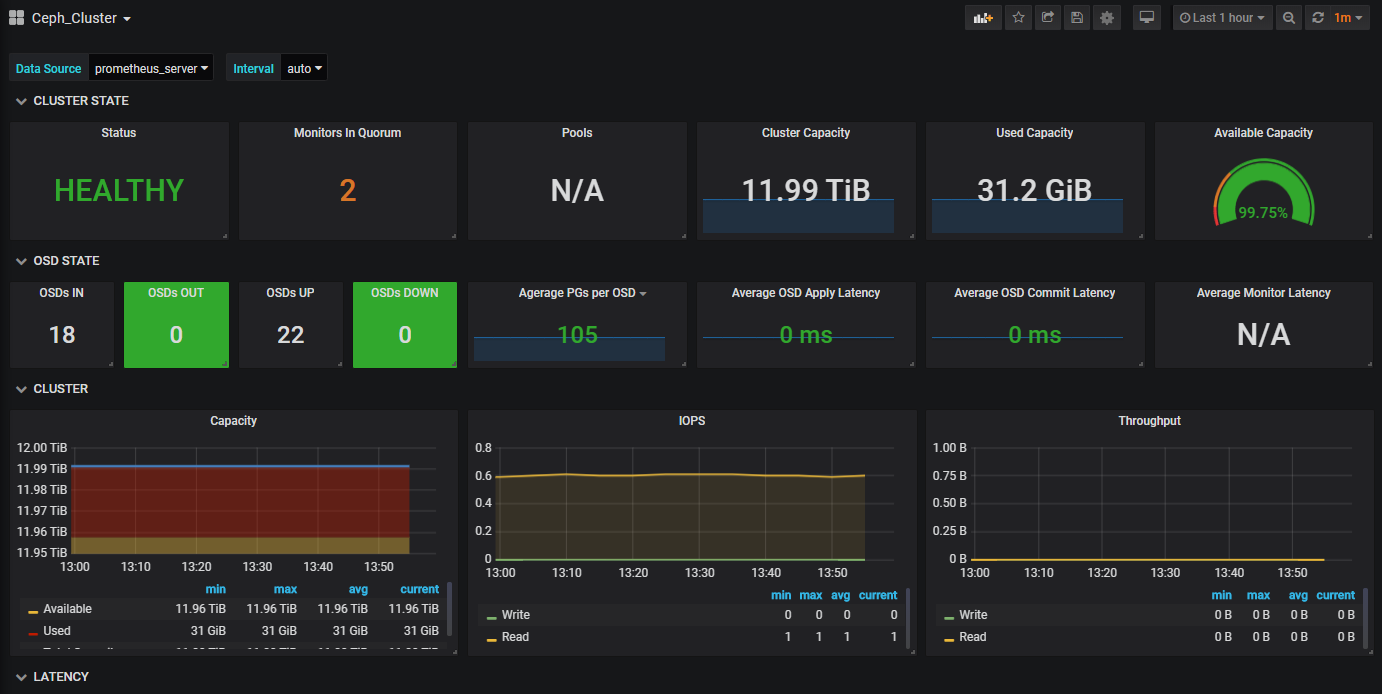
⑦ 漂亮的dashboard即可展現出來了: