


介紹過基礎的MSchart知識後,大家應該容易上手寫代碼了,最起碼搞幾個餅圖柱狀圖什麼的不在話下了。下面我們看看如何在實際項目中寫代碼。
- 柱狀圖
 1:

string strSQL;
2: DataSet ds = new DataSet();3: Chart1.ChartAreas[0].Name = "chartArea1";4: Chart1.Titles.Add("chartArea1");5: Chart1.Titles[0].Font = new Font("????", 14, FontStyle.Bold);6: strSQL = "select col1,col2 from Report";7: ds.Tables.Add(DBSQL.Query(strSQL, 300).Tables[0].Copy());8: ds.Tables[0].TableName = "chartArea1";9: if(ds.Tables[0].Rows.Count > 0)10: {11: Chart1.Series[0].Name = "chartArea1";12: Series ser_qqgzjz = Chart1.Series[0];13: ser_qqgzjz.ChartArea = "chartArea1";14: ser_qqgzjz.Points.DataBind(ds.Tables["qqgzjz"].Rows, "col2", "col1", "");15: ser_qqgzjz.IsValueShownAsLabel = true;16: Chart1.ChartAreas["chartArea1"].AxisY.Title = "Person";17: Chart1.ChartAreas["chartArea1"].AxisX.MinorGrid.LineWidth = 0;18: Chart1.ChartAreas["chartArea1"].AxisX.LabelStyle.Angle = -45;19: Chart1.ChartAreas["chartArea1"].AxisX.MajorGrid.LineDashStyle = ChartDashStyle.NotSet;20: Chart1.ChartAreas["chartArea1"].AxisY.MajorGrid.LineDashStyle = ChartDashStyle.Dash;21: } - 雙縱座標(含百分比)
 1:

// chart is your mschart control,srcSeriesName is the name of source series name,destSeriesName
 2:

// is the name of series you want to add,which is percent series,totalCount is the number
 3:

// which to caculator the percent
 4:

protected void TowGrid(Chart chart, string srcSeriesName, string destSeriesName, double totalCount)
 5:

{
 6:

    string strChartArea = chart.Series[srcSeriesName].ChartArea;
 7:

    chart.Series[srcSeriesName].ChartType = SeriesChartType.Column;
 8:

    double total = totalCount;
 9:

    Series destSeries = new Series(destSeriesName);
10:

    chart.Series.Add(destSeries);
11:

    destSeries.ChartType = SeriesChartType.Line;
12:

    destSeries.BorderWidth = 3;
13:

    destSeries.ChartArea = chart.Series[srcSeriesName].ChartArea;
14:

    destSeries.YAxisType = AxisType.Secondary;
15:

    chart.ChartAreas[strChartArea].AxisY2.Maximum = 100;
16:

    chart.ChartAreas[strChartArea].AxisY2.Title = "??????%??";
17:

    chart.ChartAreas[strChartArea].AxisY2.TitleFont = new Font("??????", 10);
18:

    destSeries.LabelFormat = "P1";
19:

    chart.ChartAreas[strChartArea].AxisY2.MajorGrid.LineDashStyle = ChartDashStyle.NotSet;
20:

    chart.ChartAreas[strChartArea].AxisX.LabelStyle.IsEndLabelVisible = false;
21:

    double percentage = 0.0;
22:

    foreach (DataPoint pt in chart.Series[srcSeriesName].Points)
23:

    {
24:

      percentage = (pt.YValues[0] * 100.0 / total);
25:

      destSeries.Points.Add(Math.Round(percentage, 2));
26:

    }
27:

    chart.Series[destSeriesName].IsValueShownAsLabel = true;
28:

    chart.Series[destSeriesName].MarkerColor = Color.Red;
29:

    chart.Series[destSeriesName].MarkerBorderColor = Color.MidnightBlue;
30:

    chart.Series[destSeriesName].MarkerStyle = MarkerStyle.Circle;
31:

    chart.Series[destSeriesName].MarkerSize = 8;
32:

    chart.Series[destSeriesName].LabelFormat = "0.#";
33:

  }
34:

}
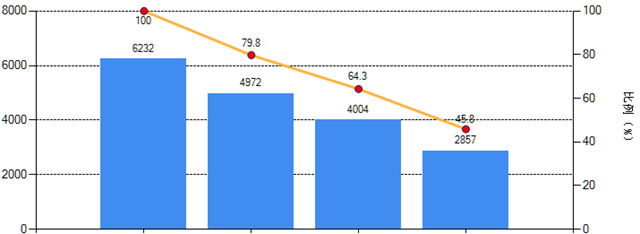
通過以上代碼的結合,就能製作出如下效果的圖表:
PS:不少網友遇到橫座標值不能完全顯示的問題,只需要修改橫座標的間隔值即可。如:
chart_ser.ChartAreas[0].AxisX.Interval = 1;
chart_ser.ChartAreas[0].AxisX.IntervalOffset = 1;

