


k8s集羣日誌收集-
收集哪些日誌
K8S系統的組件日誌
K8S Cluster裏面部署的應用程序日誌 - 日誌方案 Filebeat+ELK
Filebeat(日誌採集工具)+Logstach(數據處理引擎)+Elasticserch(數據存儲、全文檢索、分佈式搜索引擎)+Kibana(展示數據、繪圖、搜索)
3 容器中的日誌怎麼收集
收集方案:Pod中附加專用日誌收集的容器
優點:低耦合
缺點:每個Pod啓動一個日誌收集代理,增加資源消耗和運維維護成本
4 部署DaemonSet採取k8s組件日誌/var/log/messages
4.1 ELK安裝在harbor節點
安裝、配置ELK
1)安裝openjdk
yum -y install java-1.8.0-openjdk
2)安裝Logstash
https://www.elastic.co/guide/en/logstash/7.6/installing-logstash.html
配置網絡源
/etc/yum.repos.d/logstash.repo
[logstash-7.x]
name=Elastic repository for 7.x packages
baseurl=https://artifacts.elastic.co/packages/7.x/yum
gpgcheck=1
gpgkey=https://artifacts.elastic.co/GPG-KEY-elasticsearch
enabled=1
autorefresh=1
type=rpm-md
3)安裝ELK組件
yum -y install logstash elasticsearch kibana
4)配置組件
修改kibana配置
vi /etc/kibana/kibana.yml
server.port: 5601
server.host: "0.0.0.0"
elasticsearch.hosts: ["http://localhost:9200"]
修改logstash配置
vi /etc/logstash/conf.d/logstash-to-es.conf
input {
beats {
port => 5044
}
}
filter {
}
output {
elasticsearch {
hosts => ["http://127.0.0.1:9200"]
index => "k8s-log-%{+YYYY.MM.dd}" #索引格式
}
stdout { codec => rubydebug }
}
啓動服務
systemctl start kibana #啓動kibana
systemctl start elasticsearch #啓動elasticsearch
/usr/share/logstash/bin/logstash -f /etc/logstash/conf.d/logstash-to-es.conf &
192.168.1.143:5601 #訪問kibana
5) 創建pod(master節點執行)收集組件日誌
kubectl apply -f k8s-logs.yaml
apiVersion: v1
kind: ConfigMap
metadata:
name: k8s-logs-filebeat-config
namespace: kube-system
data:
filebeat.yml: |-
filebeat.prospectors:
-
type: log
paths:- /messages
fields:
app: k8s
type: module
fields_under_root: true
output.logstash:
hosts: ['192.168.1.143:5044'] - /messages
apiVersion: apps/v1
kind: DaemonSet
metadata:
name: k8s-logs
namespace: kube-system
spec:
selector:
matchLabels:
project: k8s
app: filebeat
template:
metadata:
labels:
project: k8s
app: filebeat
spec:
containers:
- name: filebeat
image: docker.elastic.co/beats/filebeat:6.4.2
args: [
"-c", "/etc/filebeat.yml",
"-e",
]
resources:
requests:
cpu: 100m
memory: 100Mi
limits:
cpu: 500m
memory: 500Mi
securityContext:
runAsUser: 0
volumeMounts:- name: filebeat-config
mountPath: /etc/filebeat.yml
subPath: filebeat.yml - name: k8s-logs
mountPath: /messages
volumes:
- name: filebeat-config
- name: k8s-logs
hostPath:
path: /var/log/messages
type: File - name: filebeat-config
configMap:
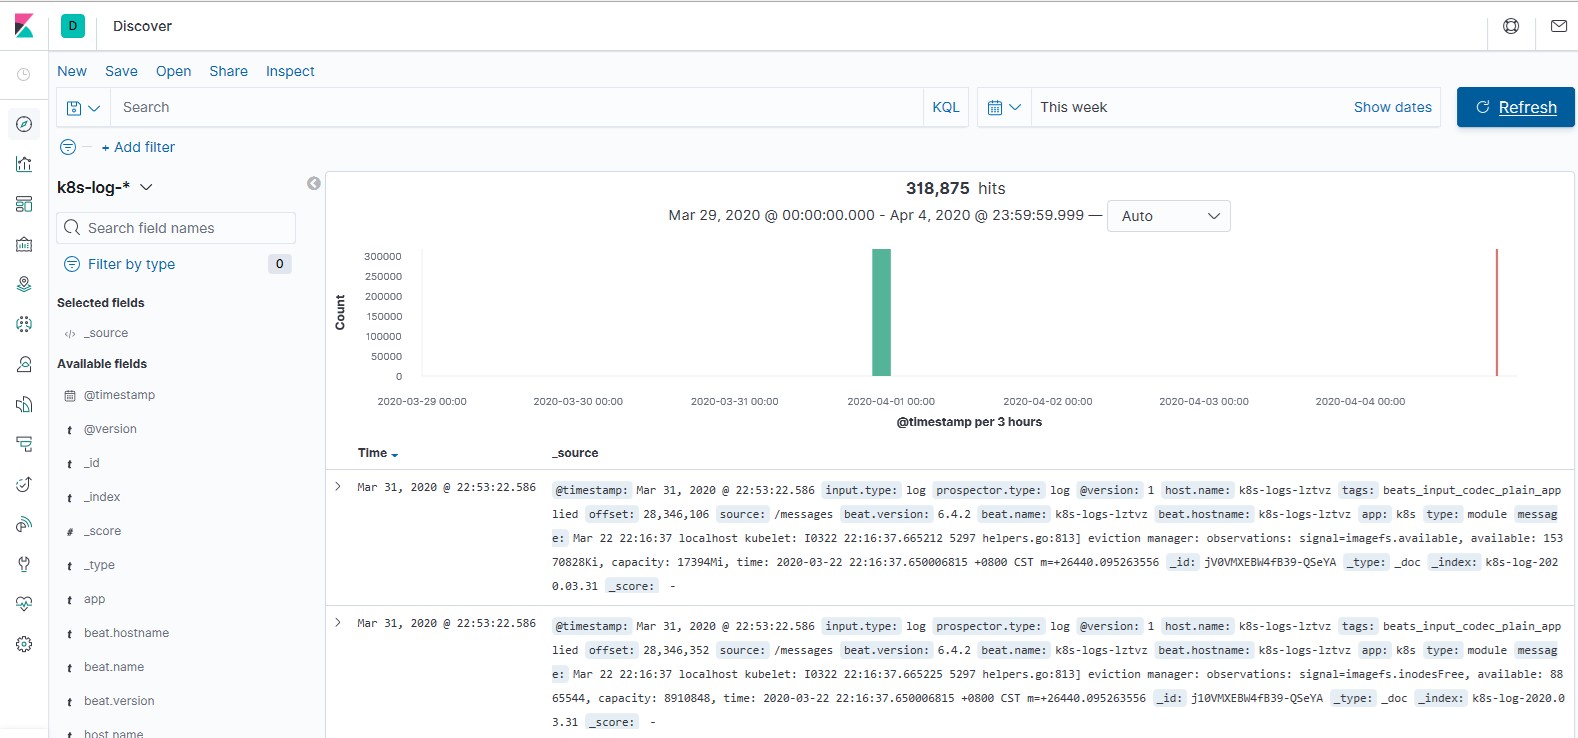
6)kibana添加索引
kibana界面->Index Patterns-》k8s-log-*->@timestamp->Create index pattern->Discover
7)查看日誌
6 收集nginx日誌
1)創建名稱空間
cat namespace.yaml
apiVersion: v1
kind: Namespace
metadata:
name: test
2)創建pod的configmap(保存filebeat的配置文件)
kubectl apply -f filebeat-nginx-configmap.yaml
cat filebeat-nginx-configmap.yaml
apiVersion: v1
kind: ConfigMap
metadata:
name: filebeat-nginx-config
namespace: test
data:
filebeat.yml: |-
filebeat.prospectors:
-
type: log
paths:- /usr/local/nginx/logs/access.log
fields: #添加額外字段,表示字段來源和類型,日誌收集時做配置
app: www
type: nginx-access
fields_under_root: true #將收集的日誌放在kibana界面頂級
- /usr/local/nginx/logs/access.log
-
type: log
paths:- /usr/local/nginx/logs/error.log
fields:
app: www
type: nginx-error
fields_under_root: true
output.logstash: #收集的日誌數據輸出到logstash中
hosts: ['192.168.1.143:5044'] - /usr/local/nginx/logs/error.log
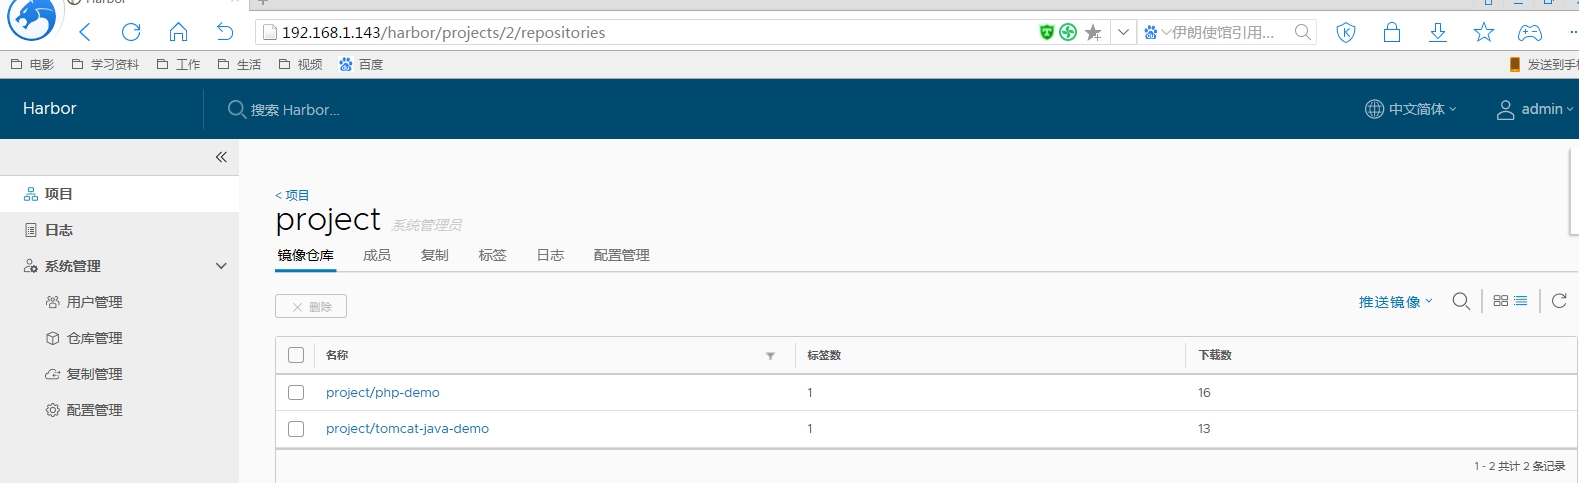
3)創建secret用於保存harbor用戶的密碼
kubectl create secret docker-registry harborsecret123 --docker-server=192.168.1.143 --docker-username='zhanghai' --docker-password='123@Abcde' -n test
4)修改logstash配置
/usr/share/logstash/bin/logstash -f /etc/logstash/conf.d/logstash-to-es.conf &
cat logstash-to-es.conf
input {
beats {
port => 5044
}
}
filter {
}
output {
if [app] == "www" {
if [type] == "nginx-access" {
elasticsearch {
hosts => ["http://127.0.0.1:9200"]
index => "nginx-access-%{+YYYY.MM.dd}"
}
}
else if [type] == "nginx-error" {
elasticsearch {
hosts => ["http://127.0.0.1:9200"]
index => "nginx-error-%{+YYYY.MM.dd}"
}
}
else if [type] == "tomcat-catalina" {
elasticsearch {
hosts => ["http://127.0.0.1:9200"]
index => "tomcat-catalina-%{+YYYY.MM.dd}"
}
}
else if [app] == "k8s" {
if [type] == "module" {
elasticsearch {
hosts => ["http://127.0.0.1:9200"]
index => "k8s-log-%{+YYYY.MM.dd}"
}
}
}
}
}
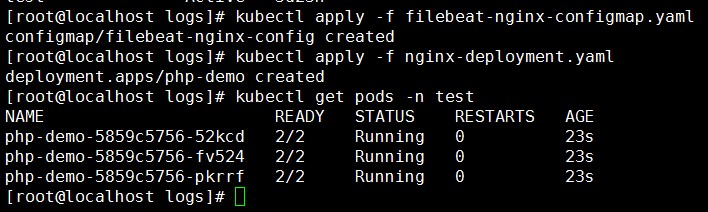
5)創建nginx的pod
kubectl apply -f nginx-deployment.yaml
cat nginx-deployment.yaml
apiVersion: apps/v1beta1
kind: Deployment
metadata:
name: php-demo
namespace: test
spec:
replicas: 3
selector:
matchLabels:
project: www
app: php-demo
template:
metadata:
labels:
project: www
app: php-demo
spec:
imagePullSecrets:
- name: harborsecret123
containers: -
name: nginx
image: 192.168.1.143/project/php-demo:latest
imagePullPolicy: Always
ports:- containerPort: 80
name: web
protocol: TCP
resources:
requests:
cpu: 0.5
memory: 256Mi
limits:
cpu: 1
memory: 1Gi
resources:
requests:
cpu: 0.5
memory: 256Mi
limits:
cpu: 1
memory: 1Gi
livenessProbe:
httpGet:
path: /status.php
port: 80
initialDelaySeconds: 6
timeoutSeconds: 20
volumeMounts: - name: nginx-logs
mountPath: /usr/local/nginx/logs
- containerPort: 80
-
name: filebeat
image: docker.elastic.co/beats/filebeat:6.4.2
args: [
"-c", "/etc/filebeat.yml",
"-e",
]
resources:
limits:
memory: 500Mi
requests:
cpu: 100m
memory: 100Mi
securityContext:
runAsUser: 0
volumeMounts:- name: filebeat-config
mountPath: /etc/filebeat.yml
subPath: filebeat.yml -
name: nginx-logs
mountPath: /usr/local/nginx/logsvolumes:
- name: filebeat-config
- name: nginx-logs
emptyDir: {} - name: filebeat-config
configMap:
name: filebeat-nginx-config
5)配置kibana前臺
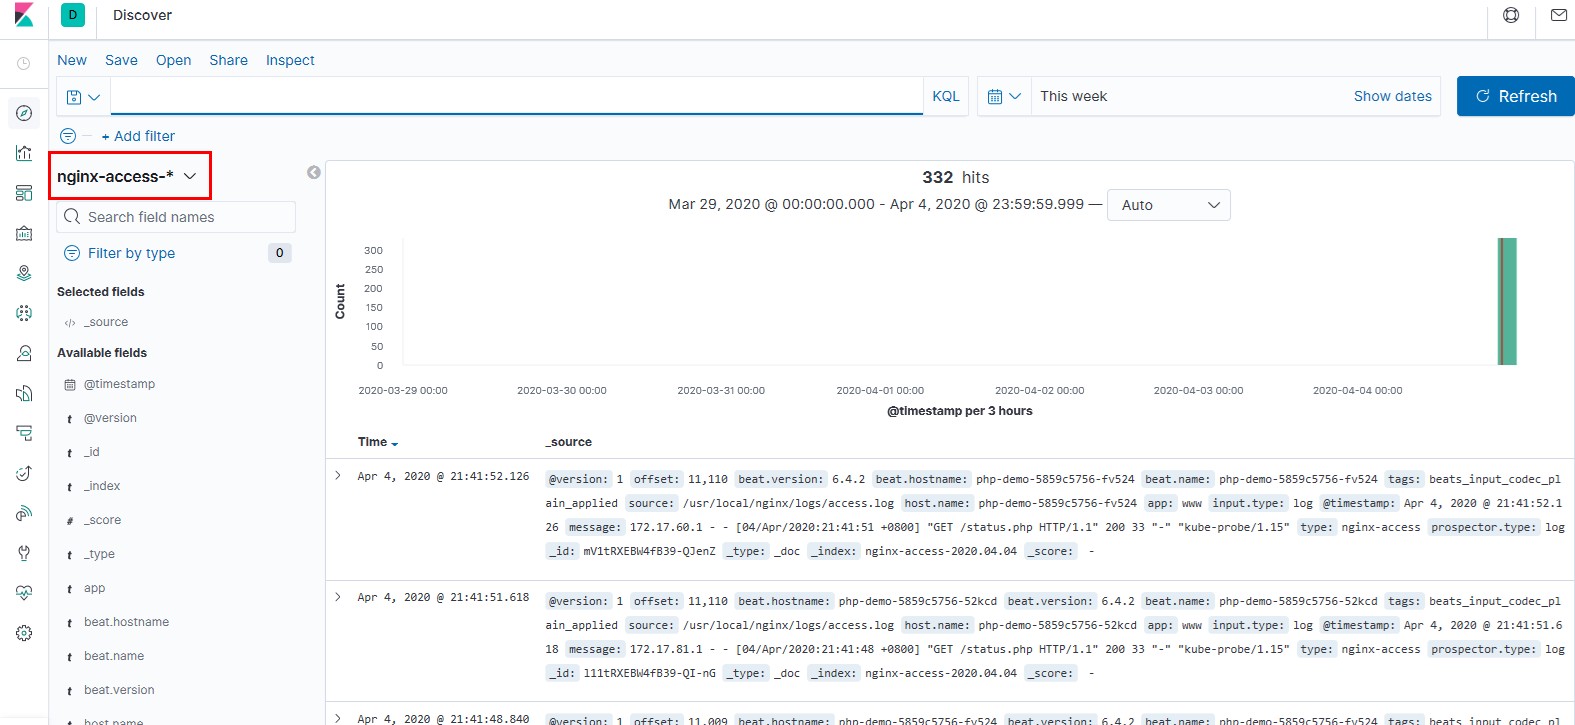
kibana界面->Kibana Index Patterns-》nginx-access-*->@timestamp->Create index pattern->Discover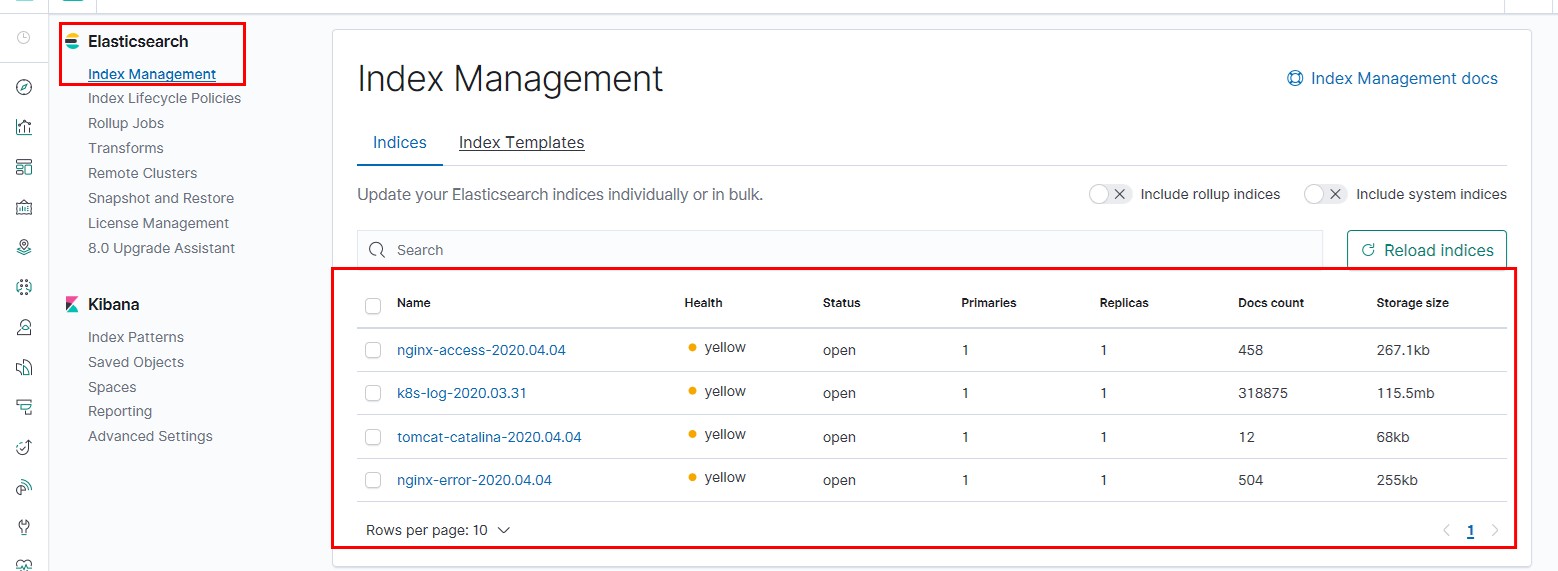
- 收集tomcat日誌
1)創建pod的configmap
cat filebeat-tomcat-configmap.yaml
apiVersion: v1
kind: ConfigMap
metadata:
name: filebeat-config
namespace: test
data:
filebeat.yml: |-
filebeat.prospectors:
- type: log
paths:- /usr/local/tomcat/logs/catalina.*
fields:
app: www
type: tomcat-catalina
fields_under_root: true
multiline: #多行匹配,已[開頭爲記錄一行日誌
pattern: '^['
negate: true
match: after
output.logstash:
hosts: ['192.168.1.143:5044']
kubectl apply -f filebeat-tomcat-configmap.yaml
- /usr/local/tomcat/logs/catalina.*
2)創建tomcat的pod
kubectl apply -f tomcat-deployment.yaml
cat tomcat-deployment.yaml
apiVersion: apps/v1beta1
kind: Deployment
metadata:
name: tomcat-java-demo
namespace: test
spec:
replicas: 3
selector:
matchLabels:
project: www
app: java-demo
template:
metadata:
labels:
project: www
app: java-demo
spec:
imagePullSecrets:
- name: harborsecret123
containers: -
name: tomcat
image: 192.168.1.143/project/tomcat-java-demo:latest
imagePullPolicy: Always
ports:- containerPort: 8080
name: web
protocol: TCP
resources:
requests:
cpu: 0.5
memory: 1Gi
limits:
cpu: 1
memory: 2Gi
livenessProbe:
httpGet:
path: /
port: 8080
initialDelaySeconds: 60
timeoutSeconds: 20
readinessProbe:
httpGet:
path: /
port: 8080
initialDelaySeconds: 60
timeoutSeconds: 20
volumeMounts: - name: tomcat-logs
mountPath: /usr/local/tomcat/logs
- containerPort: 8080
- name: filebeat
image: docker.elastic.co/beats/filebeat:6.4.2
args: [
"-c", "/etc/filebeat.yml",
"-e",
]
resources:
limits:
memory: 500Mi
requests:
cpu: 100m
memory: 100Mi
securityContext:
runAsUser: 0
volumeMounts:- name: filebeat-config
mountPath: /etc/filebeat.yml
subPath: filebeat.yml - name: tomcat-logs
mountPath: /usr/local/tomcat/logs
volumes:
- name: filebeat-config
- name: tomcat-logs
emptyDir: {} - name: filebeat-config
configMap:
name: filebeat-config
3)配置kibana前臺
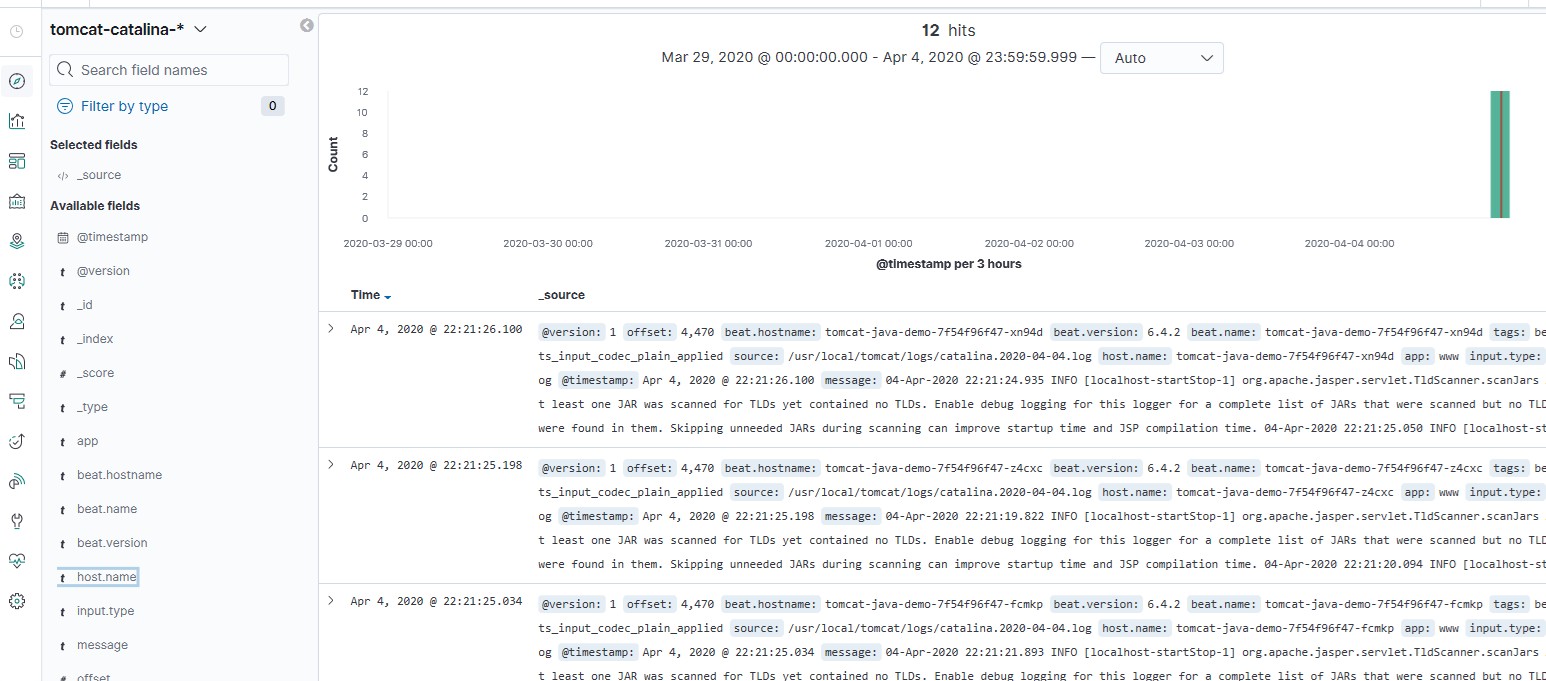
kibana界面->Kibana Index Patterns-tomcat-catalina-*->@timestamp->Create index pattern->Discover
特別聲明:本文素材來源於網絡,僅作爲分享學習之用,如有侵權,請聯繫刪除!