阿里雲日誌服務是針對日誌類數據的一站式服務,您只需要將精力集中在日誌分析上,過程中數據採集、對接各種存儲計算、數據索引和查詢等其他工作都可以通過配置日誌服務來自動完成。
在結果分析可視化上,除了使用自帶Dashboard外,還支持DataV、Grafana、Tableua、QuickBI等對接方式。本文主要通過Grafana示例演示如何通過日誌服務對Nginx日誌進行分析與可視化。
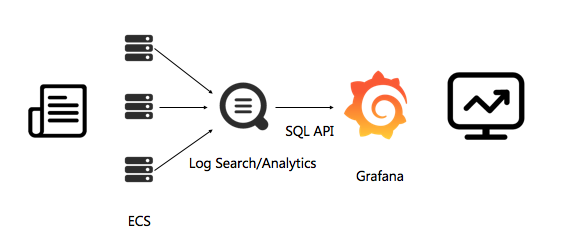
- 流程架構
日誌從收集到分析的流程架構如下:![阿里雲日誌服務對接Grafana]()
- 配置流程
1). 日誌數據採集。日誌服務採集 logtail 進行日誌採集。
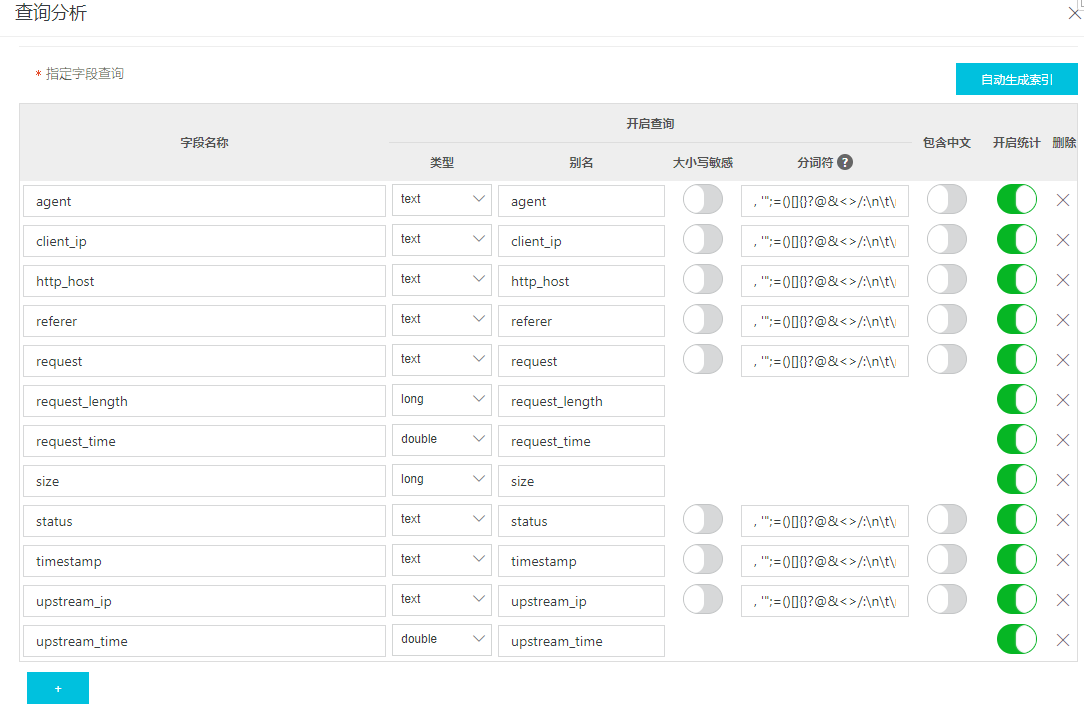
2). 索引設置與控制檯查詢配置。重設索引,根據採集到Nginx的log字段進行指定字段查詢。這裏採集到Nginx日誌格式非默認格式,根據需求已進行單獨處理且爲JSON格式。日誌服務中查詢分析已進行指定字段設置:![阿里雲日誌服務對接Grafana]()
3). 安裝Grafana插件,將實時查詢SQL轉化爲視圖。
接下來主要操作步驟3,前提是步驟1、2已經完成,能在日誌服務控制檯能查詢到log。 - 配置步驟
- Grafana安裝
Centos 7環境安裝,詳細安裝操作請參考 https://grafana.com/docs/grafana/latest/installation/rpm/
Grafana安裝版本:Grafana v6.4.4 - 安裝日誌服務插件
執行以下命令安裝插件,並重啓grafana-server。cd /var/lib/grafana/plugins/ git clone https://github.com/aliyun/aliyun-log-grafana-datasource-plugin systemctl restart grafana-server - 配置日誌數據源
在Grafana首頁左測找到Configuration配置項,選擇 Data Sources。
單擊右上角的Add data source,添加新的數據源。使用Grafana和阿里雲日誌服務進行日誌可視化分析。
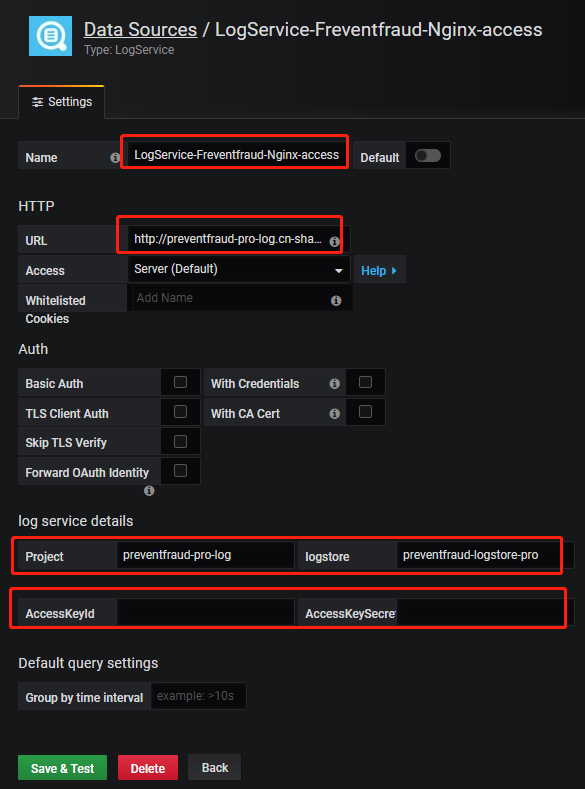
配置如下:![阿里雲日誌服務對接Grafana]()
配置內容:
Name 自定義一個新數據源的名稱。
Url 輸入樣例:http://dashboard-demo.cn-hangzhou.log.aliyuncs.com ,dashboard-demo是project名稱,cn-hangzhou.log.aliyuncs.com是project所在地域的endpoint,在配置自己的數據源時,需要替換成自己的project和region地址。
log service details 日誌服務詳細配置,分別填寫Project和Logstore,以及具備讀取權限的AccessKey。AccessKey可以是主賬號的AccessKey,也可以是子帳號的AccessKey。
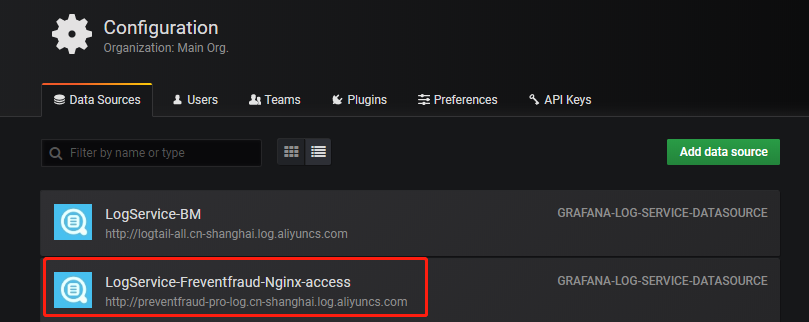
配置完成後單擊Add,即可完成添加DataSource。Configuration配置項裏 Data Sources查看已配置好的數據源。![阿里雲日誌服務對接Grafana]()
- 添加Dashboard
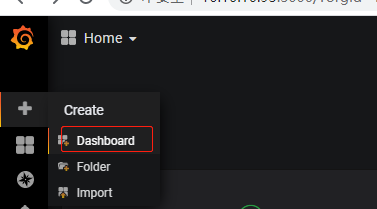
單擊打開左上角菜單,選擇"+"的Create項,單機Dashboards新加一個Dashboard。![阿里雲日誌服務對接Grafana]()
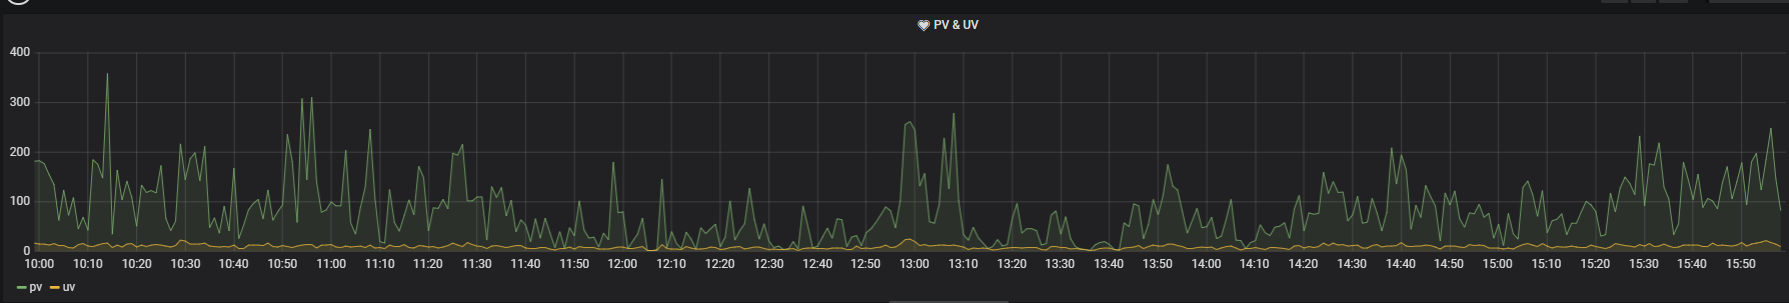
4.1 配置PV、UV![阿里雲日誌服務對接Grafana]()
a. 進入新加的Dashboard,左上角找到“Add Panel”。
b. 在該Panel中單機 “Add Query”,在 Query 中選擇剛添加的數據源。
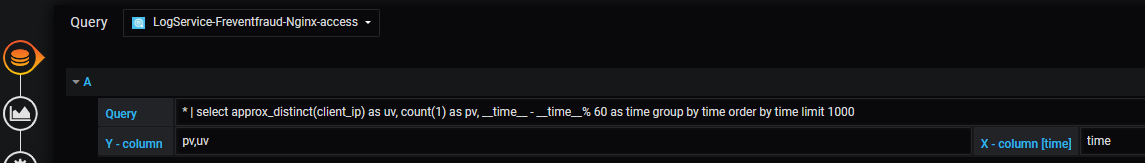
c. 找到右側 Add Query,添加一新Query,在Query中輸入✳ | select approx_distinct(client_ip) as uv, count(1) as pv, __time__ - __time__% 60 as time group by time order by time limit 1000Y - column輸入:pv,uv
X - column [time]輸入:time![阿里雲日誌服務對接Grafana]()
這塊日誌服務SQL語句,先確保能在阿里日誌查詢分析控制檯能查詢通過,有數據輸出,無語法錯誤,否則在Grafana無數據圖形顯示。
說明:
approx_distinct(client_ip):估算 client_ip 列的唯一值的個數。__time__:日誌服務每條日誌中內置的時間類型。靈活的時間維度統計,數學取模方法分組。__time_ - __time_ % 60表示按1分鐘進行取模,即1分鐘跨度顯示。
d. 在 Visualization 中,Grafana可以支持多重類型的視圖。對於PV,UV數據,在標籤欄中單擊Graph,創建一個Graph視圖。![阿里雲日誌服務對接Grafana]()
e. General中Title修改該Panel的名稱,這裏統計PV、UV,相應的名稱修改爲PV、UV。![阿里雲日誌服務對接Grafana]()
f. 最後一項Alert,暫時不設置報警通知,如果要設置報警通知,在該Panel中單擊Create Alert。在Notifications配置報警通知。![阿里雲日誌服務對接Grafana]()
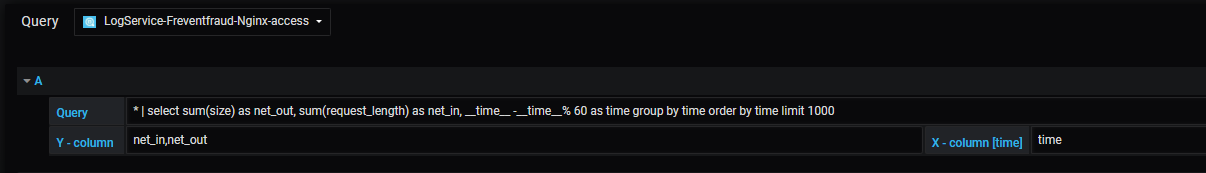
4.2 配置出入網帶寬![阿里雲日誌服務對接Grafana]()
參考4.1 配置PV、UV,使用同樣的方法添加出入網帶寬的流量。✳ | select sum(size) as net_out, sum(request_length) as net_in, __time__ -__time__% 60 as time group by time order by time limit 1000Y - column輸入:net_in,net_out
X - column [time]輸入:time![阿里雲日誌服務對接Grafana]()
4.3 不同HTTP方法的佔比![阿里雲日誌服務對接Grafana]()
✳ | select count(1) as pv, split_part(request,' ',1) as request group by requestY - column輸入:request,pv
X - column [time]輸入:pie
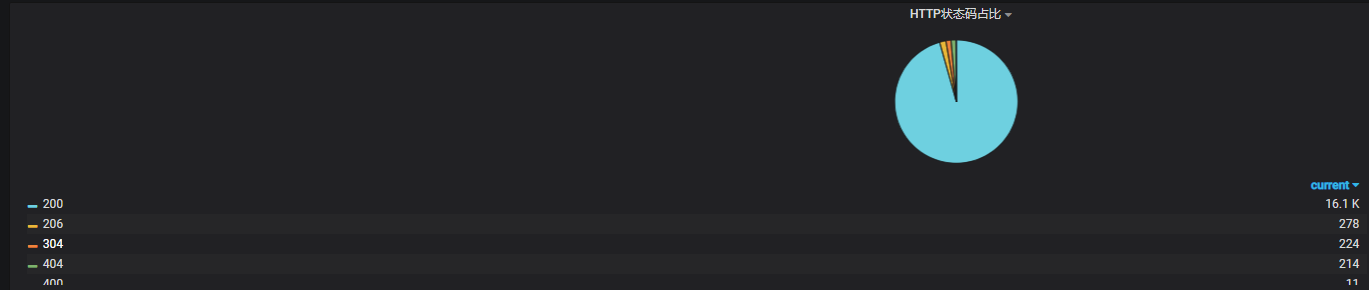
4.4 不同HTTP狀態碼佔比![阿里雲日誌服務對接Grafana]()
✳ | select count(1) as pv, status group by statusY - column輸入:status,pv
X - column [time]輸入:pie
4.5 熱門來源頁面![阿里雲日誌服務對接Grafana]()
✳ | select count(1) as pv, referer group by referer order by pv desc limit 10Y - column輸入:referer,pv
X - column [time]輸入:pie
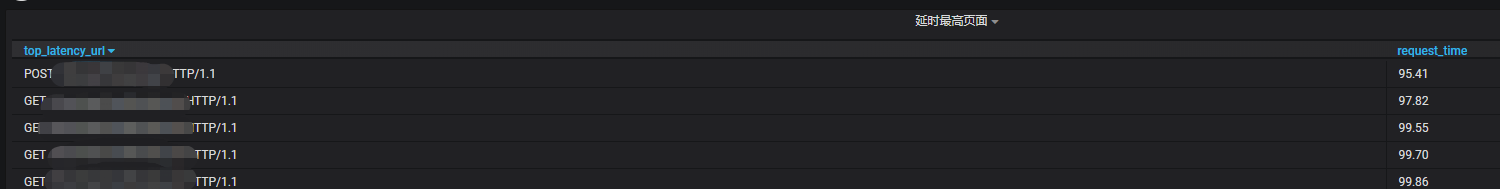
4.6 延時最高頁面![阿里雲日誌服務對接Grafana]()
✳ | select split_part(request,' ',2) as top_latency_url, request_time group by top_latency_url,request_time order by request_time desc limit 20Y - column輸入:top_latency_url, request_time
X - column [time]保持爲空。
4.7 熱門頁面![阿里雲日誌服務對接Grafana]()
✳ | select count(1) as pv, split_part(request,' ',2) as path group by path order by pv desc limit 10Y - column輸入:path,pv
X - column [time]保持爲空。
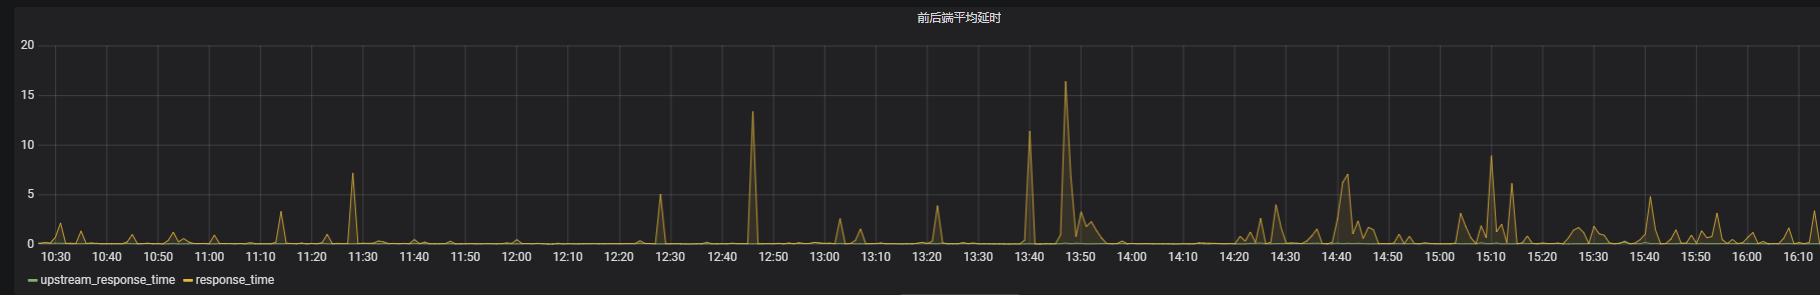
4.8 前後端平均延時![阿里雲日誌服務對接Grafana]()
✳ | select avg(request_time) as response_time, avg(upstream_time) as upstream_response_time, __time__ -__time__% 60 as time group by time order by time limit 1000Y - column輸入:upstream_response_time,response_time
X - column [time]輸入:time
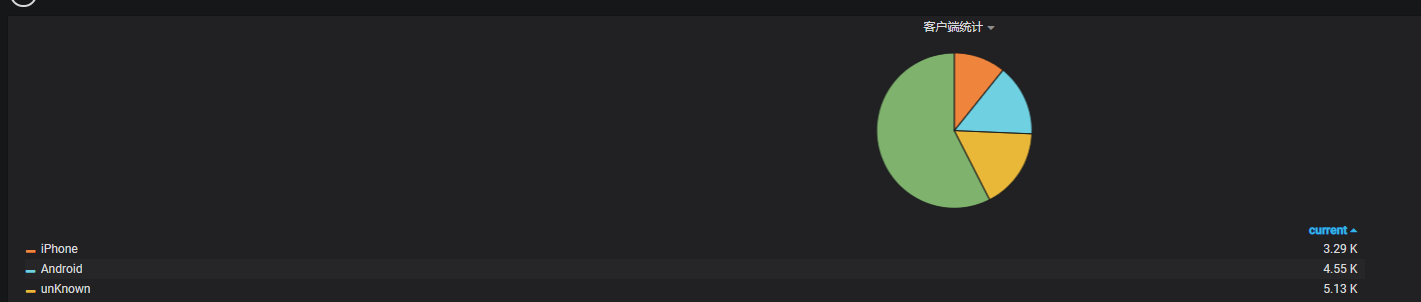
4.9 客戶端統計![阿里雲日誌服務對接Grafana]()
✳ | select count(1) as pv, case when regexp_like(agent , 'okhttp') then 'okhttp' when regexp_like(agent , 'iPhone') then 'iPhone' when regexp_like(agent , 'Android') then 'Android' else 'unKnown' end as agent group by agent order by pv desc limit 10Y - column輸入:agent,pv
X - column [time]輸入:pie
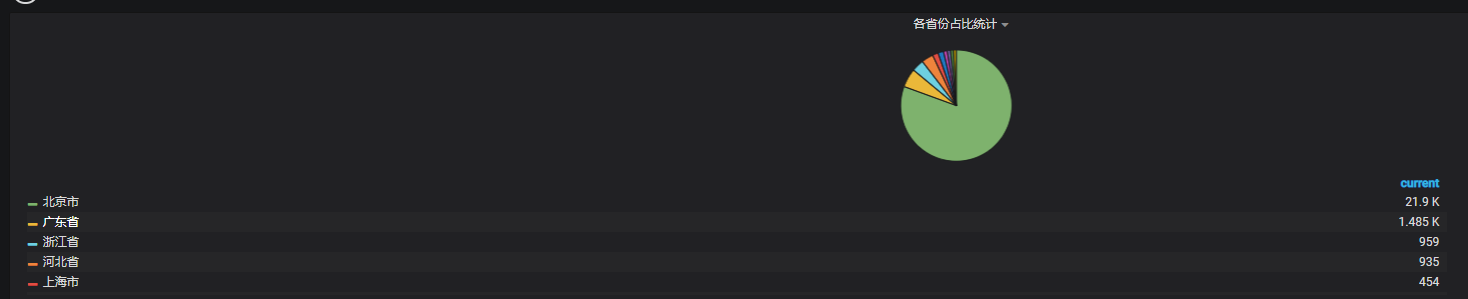
4.10 各省份佔比統計![阿里雲日誌服務對接Grafana]()
✳ | select ip_to_province(client_ip) as province, count(1) as pv group by province HAVING ip_to_province(client_ip) <> '-1' order by pv desc limit 10日誌IP地理函數 ip_to_province(client_ip) 對無效IP,會返回”-1“。針對這塊用 HAVING 過濾掉。
Y - column輸入:province,pv
X - column [time]輸入:pie
4.11 各城市佔比統計![阿里雲日誌服務對接Grafana]()
✳ | select ip_to_city(client_ip) as city, count(1) as pv group by city HAVING ip_to_city(client_ip) <> '-1' and ip_to_city(client_ip) <> '內網IP' order by pv desc limit 10Y - column輸入:city,pv
X - column [time]輸入:pie
4.12 保存和發佈Dashboard
單擊頁面上方的保存按鈕,發佈Dashboard。 - 查看Dashboard結果
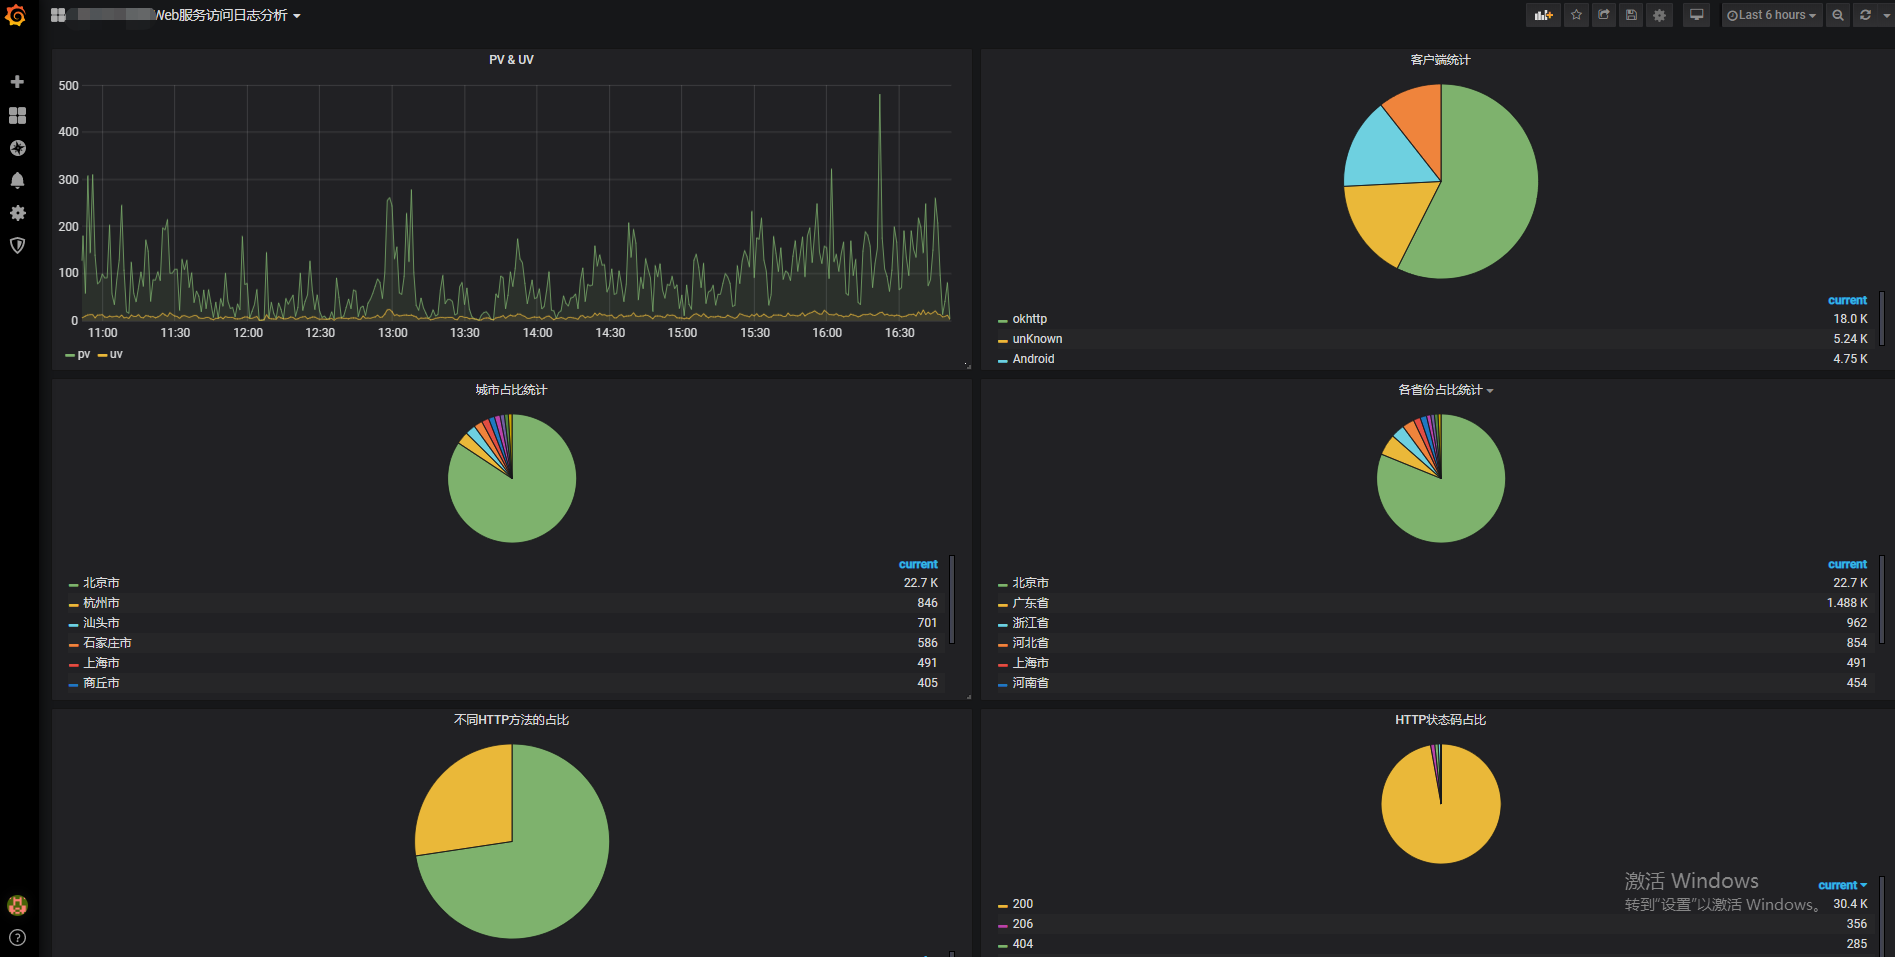
打開Dashboard首頁查看效果。![阿里雲日誌服務對接Grafana]()
以上文檔內容參考了:https://help.aliyun.com/document_detail/60952.html
- Grafana安裝