使用gnuplot繪製曲線圖
平時經常做一些性能測試,比如查看mysql的響應時間,繪製一些曲線,可以幫我們更清楚直觀的發現問題,當然也可以使用監控來實現,更簡單一些。
1、安裝gnuplot
yum -y install gnuplot
rpm -ivh chkfontpath-1.10.1-2.el6.nux.x86_64.rpm --nodeps --force
rpm -ivh msttcore-fonts-2.0-3.noarch.rpm
vim /etc/profile
export GDFONTPATH="/usr/share/fonts/msttcore/"
export GNUPLOT_DEFAULT_GDFONT="arial"
2、設置模板
模板信息如下,比如這個模板文件叫做muban.conf
set terminal gif small size 900,780 #指定輸出成gif圖片,且圖片大小爲550×25
set output "RT.gif" #指定輸出gif圖片的文件名
set autoscale
set xdata time
set timefmt "%s"
set format x "%S"
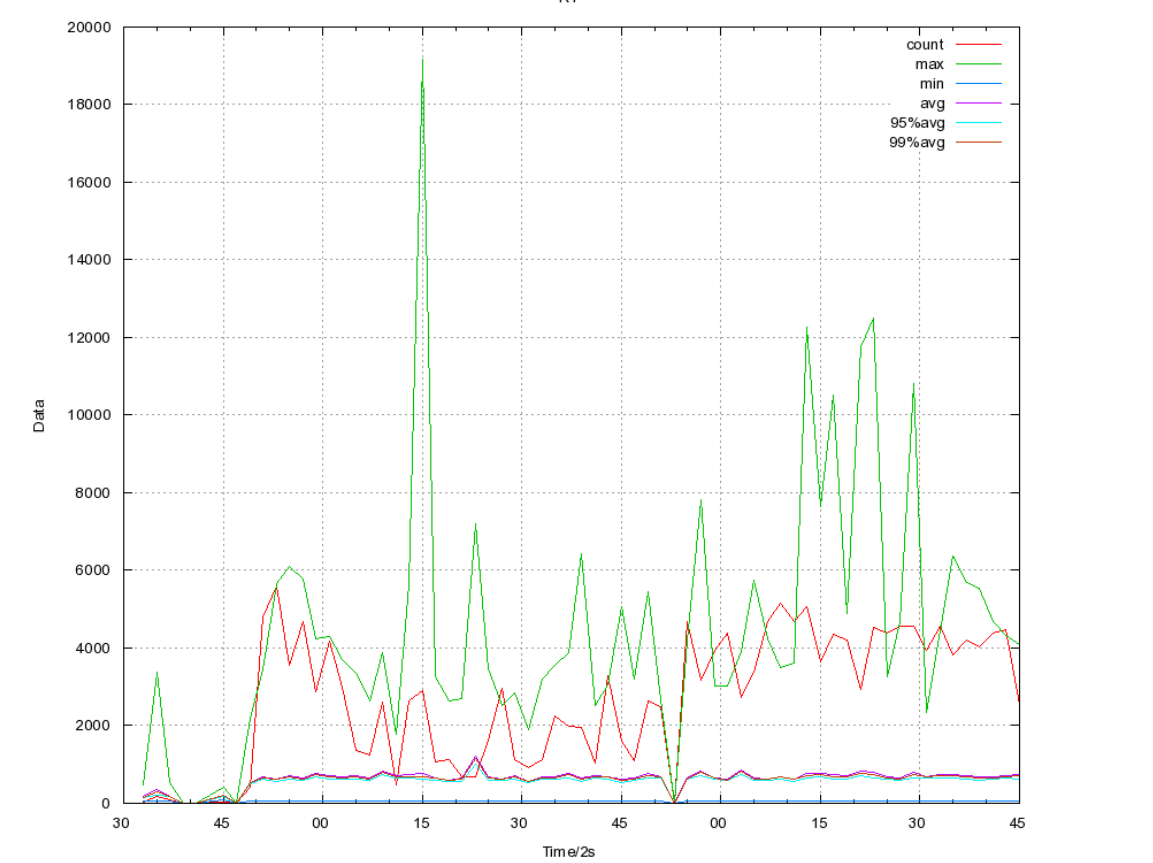
set title "RT" #圖片標題
set style data lines #顯示網格
set xlabel "Time/2s" #X軸標題
set ylabel "Data" #Y軸標題
set grid #顯示網格
plot \
"mysql_rt.txt" using 1:2 title "count" ,'' using 1:3 title "max" ,'' using 1:4 title "min" ,'' using 1:5 title "avg" ,'' using 1:9 title "95%avg" ,'' using 1:12 title "99%avg"
上面mysql_rt.txt是我們的數據文件,文件內容如下,一列一列的,這些數據是使用tcprstat採集的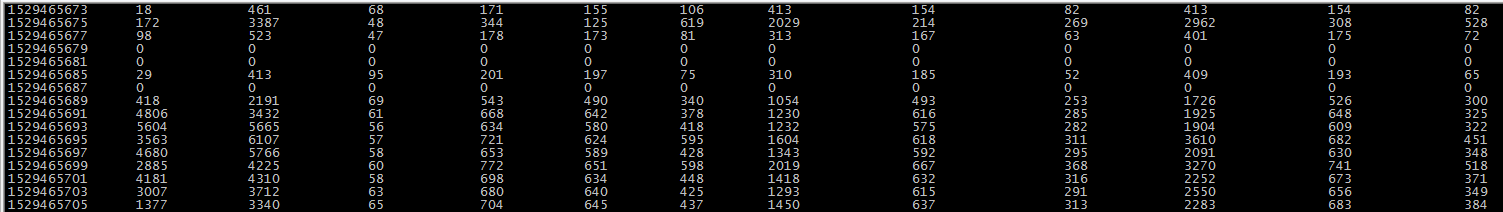
using 1:2就是第一列是x軸和第二列是y軸的數據,我同一時間有很多指標,所以1是固定的,2、3、5、9等代表各指標在1這個時間點的數據。
3、繪製圖形
命令行輸入:
cat muban.conf |gnuplot
生成了模板裏指定的圖形文件
打開RT.gif查看