ELK環境部署
基礎環境
系統:Centos7.3
防火牆、selinux:關閉
機器環境:至少兩臺
192.168.1.182 elk-node1
192.168.1.183 elk-node2
Master-slave模式
機器環境:jdk1.8+,nginx或apache
下載並安裝GPG Key
rpm --import https://packages.elastic.co/GPG-KEY-elasticsearch
添加yum倉庫
vi /etc/yum.repos.d/elasticsearch.repo
[elasticsearch-2.x]
name=Elasticsearch repository for 2.x packages
baseurl=http://packages.elastic.co/elasticsearch/2.x/centos
gpgcheck=1
gpgkey=http://packages.elastic.co/GPG-KEY-elasticsearch
enabled=1
安裝elasticsearch
yum install -y elasticsearch
配置部署(先進行elk-node1的配置)
1)配置修改配置文件
[root@elk-node1 ~]# mkdir -p /data/es-data
[root@elk-node1 ~]# vi /etc/elasticsearch/elasticsearch.yml //將裏面內容清空,配置下面內容
cluster.name: ceshi # 組名(同一個組,組名必須一致)
node.name: elk-node1 # 節點名稱,建議和主機名一致
path.data: /data/es-data # 數據存放的路徑
path.logs: /var/log/elasticsearch/ # 日誌存放的路徑
bootstrap.mlockall: true # 鎖住內存,不被使用到交換分區去
network.host: 0.0.0.0 # 網絡設置
http.port: 9200 # 端口
2)啓動並查看
[root@elk-node1 ~]# chown -R elasticsearch.elasticsearch /data/
[root@elk-node1 ~]# systemctl start elasticsearch
[root@elk-node1 ~]# systemctl status elasticsearch
CGroup: /system.slice/elasticsearch.service
└─3005 /bin/java -Xms256m -Xmx1g -Djava.awt.headless=true -XX:+UseParNewGC -XX:+UseConcMarkSweepGC -XX:CMSI...
注意:上面可以看出elasticsearch設置的內存最小256m,最大1g
[root@linux-node1 src]# netstat -antlp |egrep "9200|9300"
tcp6 0 0 :::9200 ::: LISTEN 3005/java
tcp6 0 0 :::9300 ::: LISTEN 3005/java
然後通過web訪問(訪問的瀏覽器最好用google瀏覽器)
http://192.168.1.182:9200/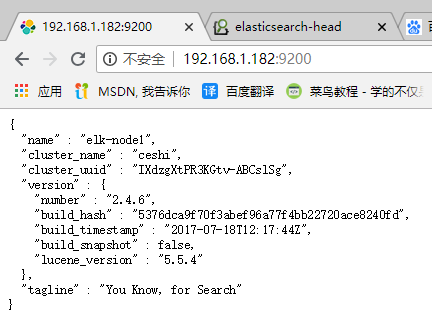
4)接下來安裝插件,使用插件進行查看~ (下面兩個插件要在elk-node1和elk-node2上都要安裝)
4.1)安裝head插件
a)插件安裝方法一
[root@elk-node1 src]# /usr/share/elasticsearch/bin/plugin install mobz/elasticsearch-head
b)插件安裝方法二
首先下載head插件,下載到/usr/loca/src目錄下
下載地址:https://github.com/mobz/elasticsearch-head
[root@elk-node1 src]# unzip elasticsearch-head-master.zip
[root@elk-node1 src]# ls
elasticsearch-head-master elasticsearch-head-master.zip
在/usr/share/elasticsearch/plugins目錄下創建head目錄
然後將上面下載的elasticsearch-head-master.zip解壓後的文件都移到/usr/share/elasticsearch/plugins/head下
接着重啓elasticsearch服務即可!
[root@elk-node1 plugins]# mkdir head
[root@elk-node1 plugins]# ls
head
[root@elk-node1 head]# pwd
/usr/share/elasticsearch/plugins/head
[root@elk-node1 head]# chown -R elasticsearch:elasticsearch /usr/share/elasticsearch/plugins
[root@elk-node1 head]# ll
total 40
-rw-r--r--. 1 elasticsearch elasticsearch 104 Sep 28 01:57 elasticsearch-head.sublime-project
-rw-r--r--. 1 elasticsearch elasticsearch 2171 Sep 28 01:57 Gruntfile.js
-rw-r--r--. 1 elasticsearch elasticsearch 3482 Sep 28 01:57 grunt_fileSets.js
-rw-r--r--. 1 elasticsearch elasticsearch 1085 Sep 28 01:57 index.html
-rw-r--r--. 1 elasticsearch elasticsearch 559 Sep 28 01:57 LICENCE
-rw-r--r--. 1 elasticsearch elasticsearch 795 Sep 28 01:57 package.json
-rw-r--r--. 1 elasticsearch elasticsearch 100 Sep 28 01:57 plugin-descriptor.properties
-rw-r--r--. 1 elasticsearch elasticsearch 5211 Sep 28 01:57 README.textile
drwxr-xr-x. 5 elasticsearch elasticsearch 4096 Sep 28 01:57 _site
drwxr-xr-x. 4 elasticsearch elasticsearch 29 Sep 28 01:57 src
drwxr-xr-x. 4 elasticsearch elasticsearch 66 Sep 28 01:57 test
[root@elk-node1 _site]# systemctl restart elasticsearch
插件訪問(最好提前將elk-node2節點的配置和插件都安裝後,再來進行訪問和數據插入測試)
http://192.168.1.182:9200/_plugin/head/
下面進行節點elk-node2的配置 (如上的兩個插件也在elk-node2上同樣安裝)
註釋:其實兩個的安裝配置基本上是一樣的。
[root@elk-node2 src]# mkdir -p /data/es-data
[root@elk-node2 ~]# cat /etc/elasticsearch/elasticsearch.yml
cluster.name: ceshi
node.name: elk-node2
path.data: /data/es-data
path.logs: /var/log/elasticsearch/
bootstrap.mlockall: true
network.host: 0.0.0.0
http.port: 9200
discovery.zen.ping.multicast.enabled: false
discovery.zen.ping.unicast.hosts: ["192.168.1.182", "192.168.1.183"]
修改權限配置
[root@elk-node2 src]# chown -R elasticsearch.elasticsearch /data/
啓動服務
[root@elk-node2 src]# systemctl start elasticsearch
[root@elk-node2 src]# systemctl status elasticsearch
● elasticsearch.service - Elasticsearch
Loaded: loaded (/usr/lib/systemd/system/elasticsearch.service; enabled; vendor preset: disabled)
Active: active (running) since Wed 2018-08-28 16:49:41 CST; 1 weeks 3 days ago
Docs: http://www.elastic.co
Process: 17798 ExecStartPre=/usr/share/elasticsearch/bin/elasticsearch-systemd-pre-exec (code=exited, status=0/SUCCESS)
Main PID: 17800 (java)
CGroup: /system.slice/elasticsearch.service
└─17800 /bin/java -Xms256m -Xmx1g -Djava.awt.headless=true -XX:+UseParNewGC -XX:+UseConcMarkSweepGC -XX:CMSInitiatingOccupancyFra...
09 13:42:22 elk-node2 elasticsearch[17800]: [2016-10-09 13:42:22,295][WARN ][transport ] [elk-node2] Transport res...943817]
09 13:42:23 elk-node2 elasticsearch[17800]: [2016-10-09 13:42:23,111][WARN ][transport ] [elk-node2] Transport res...943846]
................
................
查看端口
[root@elk-node2 src]# netstat -antlp|egrep "9200|9300"
tcp6 0 0 :::9200 ::: LISTEN 2928/java
tcp6 0 0 :::9300 ::: LISTEN 2928/java
tcp6 0 0 127.0.0.1:48200 127.0.0.1:9300 TIME_WAIT -
tcp6 0 0 ::1:41892 ::1:9300 TIME_WAIT -
測試: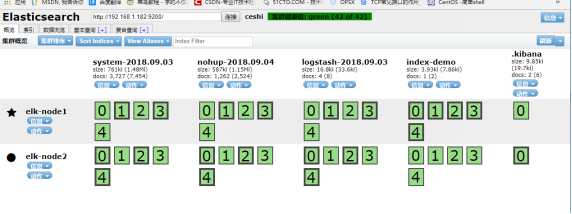
訪問插件:
http://192.168.1.182:9200/_plugin/head/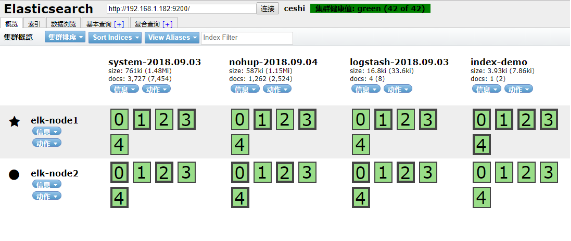
添加yum倉庫
[root@hadoop-node1 ~]# vi /etc/yum.repos.d/logstash.repo
[logstash-2.1]
name=Logstash repository for 2.1.x packages
baseurl=http://packages.elastic.co/logstash/2.1/centos
gpgcheck=1
gpgkey=http://packages.elastic.co/GPG-KEY-elasticsearch
enabled=1
安裝logstash
[root@elk-node1 ~]# yum install -y logstash
logstash啓動
[root@elk-node1 ~]# systemctl start logstash
[root@elk-node1 ~]# systemctl status logstash
● logstash.service - LSB: Starts Logstash as a daemon.
Loaded: loaded (/etc/rc.d/init.d/logstash; bad; vendor preset: disabled)
Active: active (exited) since 一 2018-09-03 16:36:07 CST; 19h ago
Docs: man:systemd-sysv-generator(8)
Process: 1699 ExecStart=/etc/rc.d/init.d/logstash start (code=exited, status=0/SUCCESS)
9月 03 16:36:07 elk-node1 systemd[1]: Starting LSB: Starts Logstash as a daemon....
9月 03 16:36:07 elk-node1 logstash[1699]: logstash started.
9月 03 16:36:07 elk-node1 systemd[1]: Started LSB: Starts Logstash as a daemon..
數據的測試
1)基本的輸入輸出
[root@elk-node1 ~]# /opt/logstash/bin/logstash -e 'input { stdin{} } output { stdout{} }'
Settings: Default filter workers: 1
Logstash startup completed
hello #輸入這個
2018-08-28T04:41:07.690Z elk-node1 hello #輸出這個
lihongwu #輸入這個
2018-08-28T04:41:10.608Z elk-node1 lihongwu #輸出這個
logstash的配置和文件的編寫
1)logstash的配置
簡單的配置方式:
[root@elk-node1 ~]# vi /etc/logstash/conf.d/01-logstash.conf
input { stdin { } }
output {
elasticsearch { hosts => ["192.168.1.182:9200"]}
stdout { codec => rubydebug }
}
它的執行:
[root@elk-node1 ~]# /opt/logstash/bin/logstash -f /etc/logstash/conf.d/01-logstash.conf
Settings: Default filter workers: 1
Logstash startup completed
beijing #輸入內容
{ #輸出下面信息
"message" => "beijing",
"@version" => "1",
"@timestamp" => "2018-08-28T04:41:48.401Z",
"host" => "elk-node1"
}
(3)Kibana安裝配置
1)kibana的安裝:
[root@elk-node1 ~]# cd /usr/local/src
[root@elk-node1 src]# wget https://download.elastic.co/kibana/kibana/kibana-4.3.1-linux-x64.tar.gz
[root@elk-node1 src]# tar zxf kibana-4.3.1-linux-x64.tar.gz
[root@elk-node1 src]# mv kibana-4.3.1-linux-x64 /usr/local/
[root@elk-node1 src]# ln -s /usr/local/kibana-4.3.1-linux-x64/ /usr/local/kibana
2)修改配置文件:
[root@elk-node1 config]# pwd
/usr/local/kibana/config
[root@elk-node1 config]# cp kibana.yml kibana.yml.bak
[root@elk-node1 config]# vi kibana.yml
server.port: 5601
server.host: "0.0.0.0"
elasticsearch.url: "http://192.168.1.182:9200"
kibana.index: ".kibana"
因爲他一直運行在前臺,要麼選擇開一個窗口,要麼選擇使用screen。
安裝並使用screen啓動kibana:
[root@elk-node1 ~]# yum -y install screen
[root@elk-node1 ~]# screen #這樣就另開啓了一個終端窗口
[root@elk-node1 ~]# /usr/local/kibana/bin/kibana
log [17:23:19.867] [info][status][plugin:kibana] Status changed from uninitialized to green - Ready
log [17:23:19.911] [info][status][plugin:elasticsearch] Status changed from uninitialized to yellow - Waiting for Elasticsearch
log [17:23:19.941] [info][status][plugin:kbn_vislib_vis_types] Status changed from uninitialized to green - Ready
log [17:23:19.953] [info][status][plugin:markdown_vis] Status changed from uninitialized to green - Ready
log [17:23:19.963] [info][status][plugin:metric_vis] Status changed from uninitialized to green - Ready
log [17:23:19.995] [info][status][plugin:spyModes] Status changed from uninitialized to green - Ready
log [17:23:20.004] [info][status][plugin:statusPage] Status changed from uninitialized to green - Ready
log [17:23:20.010] [info][status][plugin:table_vis] Status changed from uninitialized to green - Ready
然後按ctrl+a+d組合鍵,暫時斷開screen會話
這樣在上面另啓的screen屏裏啓動的kibana服務就一直運行在前臺了....
[root@elk-node1 ~]# screen -ls
There is a screen on:
15041.pts-0.elk-node1 (Detached)
1 Socket in /var/run/screen/S-root.
注:screen重新連接會話
下例顯示當前有兩個處於detached狀態的screen會話,你可以使用screen -r <screen_pid>重新連接上:
[root@tivf18 root]# screen –ls
There are screens on:
8736.pts-1.tivf18 (Detached)
8462.pts-0.tivf18 (Detached)
2 Sockets in /root/.screen.
[root@tivf18 root]# screen -r 8736
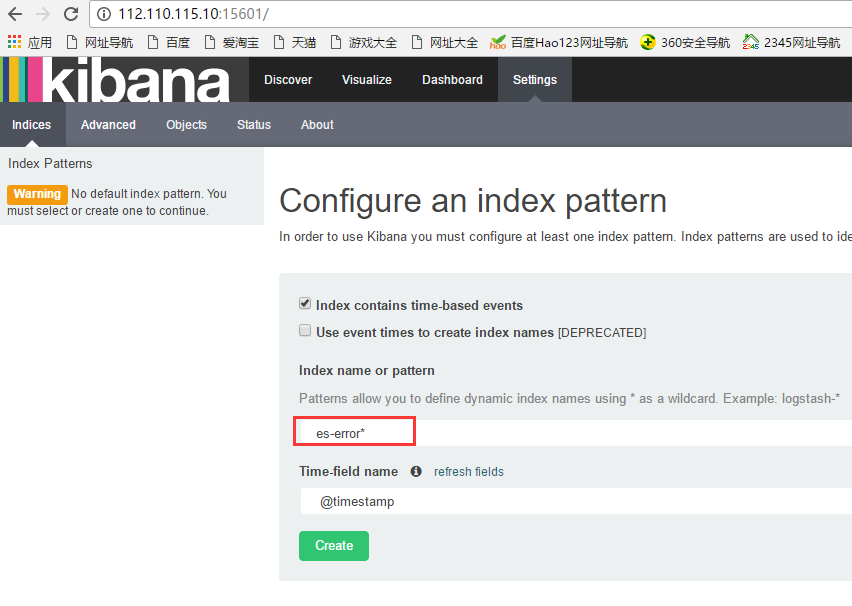
(3)訪問kibana:http://192.168.1.182:5601/
如下,如果是添加上面設置的java日誌收集信息,則在下面填寫es-error;如果是添加上面設置的系統日誌信息system,以此類型(可以從logstash界面看到日誌收集項)