


相關推薦:
使用Prometheus Operator監控kubetnetes集羣
一、前言
在之前文章中爲大家講解了如何在Kubernetes集羣中部署Prometheus,已經可以通過Prometheus監控Kubernetes中Pod的狀態、核心組件的狀態等數據。那麼如何將應用自身的數據進行集成呢?
首先prometheus對收集的數據格式是有一定的要求的,具體格式如下,只有符合此格式的prometheus纔會正常的採集,所以在應用中我們需要能把關鍵性的監控數據以此格式拋出來。
nginx_http_connections{state="active"} 2
nginx_http_connections{state="reading"} 0
nginx_http_connections{state="waiting"} 1
nginx_http_connections{state="writing"} 1
nginx_http_request_bytes_sent{host="10.46.0.4"} 11055968
nginx_http_request_bytes_sent{host="testservers"} 4640
nginx_http_request_time_bucket{host="10.46.0.4",le="00.005"} 3960
...
至於怎麼把監控指標數據拋出來,可能需要從應用本身動手。Prometheus社區也提供了大量的官方以及第三方Exporters,可以滿足Prometheus的採納者快速實現對關鍵業務,以及基礎設施的監控需求。
官方以及第三方Exporters請參考此鏈接。
此處我們建議直接使用Prometheus的Client進行註冊監控接口。Promehtues的Client目前支持大部分編程語言,支持列表可以參考如下文章。
prometheus client支持的語言列表。
二、應用監控
本次是使用nginx demo鏡像來演示。具體請參考demo鏡像。
1. 創建deployment和service
apiVersion: apps/v1beta1
kind: Deployment
metadata:
  name: nginx-demo
  labels:
    app: nginx-demo
spec:
  replicas: 1
  selector:
    matchLabels:
      app: nginx-demo
  template:
    metadata:
      labels:
        app: nginx-demo
    spec:
      containers:
      - name: nginx-demo
        image: sophos/nginx-prometheus-metrics:latest
        ports:
        - name: http-metrics
          containerPort: 9527
        - name: web
          containerPort: 80
        - name: test
          containerPort: 1314
        imagePullPolicy: IfNotPresent
---
apiVersion: v1
kind: Service
metadata:
  labels:
    app: nginx-demo
  name: nginx-demo
  namespace: default
spec:
  ports:
  - name: http-metrics
    port: 9527
    protocol: TCP
    targetPort: 9527
  - name: web
    port: 80
    protocol: TCP
    targetPort: 80
  - name: test
    port: 1314
    protocol: TCP
    targetPort: 1314
  selector:
    app: nginx-demo
  type: ClusterIP
2. 創建ServiceMonitor
由於prometheus裏指定了serviceMonitor的標籤必須release: p纔會去抓取數據,所以在我們應用的ServiceMonitor中必須加上此標籤。
[root@node-01 ~]# kubectl -n monitoring get prometheus p-prometheus -o yaml

...
  serviceMonitorSelector:
    matchLabels:
      release: p
...(其餘內容省略)
apiVersion: monitoring.coreos.com/v1
kind: ServiceMonitor
metadata:
labels:
app: nginx-demo
release: p
name: nginx-demo
namespace: monitoring
#prometheus的namespace
spec:
endpoints:
- interval: 15s
port: http-metrics
namespaceSelector:
matchNames:
- default
#nginx demo的namespace
selector:
matchLabels:
app: nginx-demo此處需要特別做些解釋,serviceMonitor是Prometheus Operator中抽象的概念,他的作用就是講配置Prometheus採集Target的配置變化成爲動態發現的方式,可以serviceMonitor通過Deployment對應的Service配置進行掛鉤,通過label selector選擇Service,並自動發現後端容器。其中需要注意的是namespace字段永遠爲monitoring,而namespaceSelector中則是選擇的應用所在的namespace。
創建完成可以看到endpoints
[root@node-01 ~]# kubectl get ep
NAME                       ENDPOINTS                                      AGE
heketi                     10.45.0.3:8080                                 36d
heketi-storage-endpoints   10.31.90.204:1,10.31.90.205:1,10.31.90.206:1   36d
kubernetes                 10.31.90.201:6443                              38d
nginx-demo                 10.46.0.4:9527,10.46.0.4:80,10.46.0.4:1314     6h
tomcat 10.34.0.0:8080 38d然後我們訪問10.46.0.4:1314,生成一些測試指標。
[root@node-01 ~]# curl 10.46.0.4:1314
hello world訪問10.46.0.4:9527/metrics,查看監控數據
[root@node-01 ~]# curl 10.46.0.4:9527/metrics
# HELP nginx_http_connections Number of HTTP connections
# TYPE nginx_http_connections gauge
nginx_http_connections{state="active"} 2
nginx_http_connections{state="reading"} 0
nginx_http_connections{state="waiting"} 1
nginx_http_connections{state="writing"} 1
# HELP nginx_http_request_bytes_sent Number of HTTP request bytes sent
# TYPE nginx_http_request_bytes_sent counter
nginx_http_request_bytes_sent{host="10.46.0.4"} 16885674
nginx_http_request_bytes_sent{host="testservers"} 4800
# HELP nginx_http_request_time HTTP request time
# TYPE nginx_http_request_time histogram
nginx_http_request_time_bucket{host="10.46.0.4",le="00.005"} 4437
nginx_http_request_time_bucket{host="10.46.0.4",le="00.010"} 4437
nginx_http_request_time_bucket{host="10.46.0.4",le="00.020"} 4437
nginx_http_request_time_bucket{host="10.46.0.4",le="00.030"} 4437
nginx_http_request_time_bucket{host="10.46.0.4",le="00.050"} 4437
nginx_http_request_time_bucket{host="10.46.0.4",le="00.075"} 4437
nginx_http_request_time_bucket{host="10.46.0.4",le="00.100"} 4437
nginx_http_request_time_bucket{host="10.46.0.4",le="00.200"} 4437
nginx_http_request_time_bucket{host="10.46.0.4",le="00.300"} 4437
nginx_http_request_time_bucket{host="10.46.0.4",le="00.400"} 4437
nginx_http_request_time_bucket{host="10.46.0.4",le="00.500"} 4437
nginx_http_request_time_bucket{host="10.46.0.4",le="00.750"} 4437
nginx_http_request_time_bucket{host="10.46.0.4",le="01.000"} 4437
nginx_http_request_time_bucket{host="10.46.0.4",le="01.500"} 4437
nginx_http_request_time_bucket{host="10.46.0.4",le="02.000"} 4437
nginx_http_request_time_bucket{host="10.46.0.4",le="03.000"} 4443
nginx_http_request_time_bucket{host="10.46.0.4",le="04.000"} 4443
nginx_http_request_time_bucket{host="10.46.0.4",le="05.000"} 4443
nginx_http_request_time_bucket{host="10.46.0.4",le="10.000"} 4443
nginx_http_request_time_bucket{host="10.46.0.4",le="+Inf"} 4443
nginx_http_request_time_bucket{host="testservers",le="00.005"} 30
nginx_http_request_time_bucket{host="testservers",le="00.010"} 30
nginx_http_request_time_bucket{host="testservers",le="00.020"} 30
nginx_http_request_time_bucket{host="testservers",le="00.030"} 30
nginx_http_request_time_bucket{host="testservers",le="00.050"} 30
nginx_http_request_time_bucket{host="testservers",le="00.075"} 30
nginx_http_request_time_bucket{host="testservers",le="00.100"} 30
nginx_http_request_time_bucket{host="testservers",le="00.200"} 30
nginx_http_request_time_bucket{host="testservers",le="00.300"} 30
nginx_http_request_time_bucket{host="testservers",le="00.400"} 30
nginx_http_request_time_bucket{host="testservers",le="00.500"} 30
nginx_http_request_time_bucket{host="testservers",le="00.750"} 30
nginx_http_request_time_bucket{host="testservers",le="01.000"} 30
nginx_http_request_time_bucket{host="testservers",le="01.500"} 30
nginx_http_request_time_bucket{host="testservers",le="02.000"} 30
nginx_http_request_time_bucket{host="testservers",le="03.000"} 30
nginx_http_request_time_bucket{host="testservers",le="04.000"} 30
nginx_http_request_time_bucket{host="testservers",le="05.000"} 30
nginx_http_request_time_bucket{host="testservers",le="10.000"} 30
nginx_http_request_time_bucket{host="testservers",le="+Inf"} 30
nginx_http_request_time_count{host="10.46.0.4"} 4443
nginx_http_request_time_count{host="testservers"} 30
nginx_http_request_time_sum{host="10.46.0.4"} 12.044999361038
nginx_http_request_time_sum{host="testservers"} 0
# HELP nginx_http_requests Number of HTTP requests
# TYPE nginx_http_requests counter
nginx_http_requests{host="10.46.0.4",status="200"} 4443
nginx_http_requests{host="testservers",status="200"} 30
# HELP nginx_http_upstream_bytes_received Number of HTTP upstream bytes received
# TYPE nginx_http_upstream_bytes_received counter
nginx_http_upstream_bytes_received{addr="10.12.13.14:80"} 0
nginx_http_upstream_bytes_received{addr="127.0.0.1:80"} 4800
# HELP nginx_http_upstream_connect_time HTTP upstream connect time
# TYPE nginx_http_upstream_connect_time histogram
nginx_http_upstream_connect_time_bucket{addr="10.12.13.14:80",le="03.000"} 6
nginx_http_upstream_connect_time_bucket{addr="10.12.13.14:80",le="04.000"} 6
nginx_http_upstream_connect_time_bucket{addr="10.12.13.14:80",le="05.000"} 6
nginx_http_upstream_connect_time_bucket{addr="10.12.13.14:80",le="10.000"} 6
nginx_http_upstream_connect_time_bucket{addr="10.12.13.14:80",le="+Inf"} 6
nginx_http_upstream_connect_time_bucket{addr="127.0.0.1:80",le="00.005"} 30
nginx_http_upstream_connect_time_bucket{addr="127.0.0.1:80",le="00.010"} 30
nginx_http_upstream_connect_time_bucket{addr="127.0.0.1:80",le="00.020"} 30
nginx_http_upstream_connect_time_bucket{addr="127.0.0.1:80",le="00.030"} 30
nginx_http_upstream_connect_time_bucket{addr="127.0.0.1:80",le="00.050"} 30
nginx_http_upstream_connect_time_bucket{addr="127.0.0.1:80",le="00.075"} 30
nginx_http_upstream_connect_time_bucket{addr="127.0.0.1:80",le="00.100"} 30
nginx_http_upstream_connect_time_bucket{addr="127.0.0.1:80",le="00.200"} 30
nginx_http_upstream_connect_time_bucket{addr="127.0.0.1:80",le="00.300"} 30
nginx_http_upstream_connect_time_bucket{addr="127.0.0.1:80",le="00.400"} 30
nginx_http_upstream_connect_time_bucket{addr="127.0.0.1:80",le="00.500"} 30
nginx_http_upstream_connect_time_bucket{addr="127.0.0.1:80",le="00.750"} 30
nginx_http_upstream_connect_time_bucket{addr="127.0.0.1:80",le="01.000"} 30
nginx_http_upstream_connect_time_bucket{addr="127.0.0.1:80",le="01.500"} 30
nginx_http_upstream_connect_time_bucket{addr="127.0.0.1:80",le="02.000"} 30
nginx_http_upstream_connect_time_bucket{addr="127.0.0.1:80",le="03.000"} 30
nginx_http_upstream_connect_time_bucket{addr="127.0.0.1:80",le="04.000"} 30
nginx_http_upstream_connect_time_bucket{addr="127.0.0.1:80",le="05.000"} 30
nginx_http_upstream_connect_time_bucket{addr="127.0.0.1:80",le="10.000"} 30
nginx_http_upstream_connect_time_bucket{addr="127.0.0.1:80",le="+Inf"} 30
nginx_http_upstream_connect_time_count{addr="10.12.13.14:80"} 6
nginx_http_upstream_connect_time_count{addr="127.0.0.1:80"} 30
nginx_http_upstream_connect_time_sum{addr="10.12.13.14:80"} 12.015
nginx_http_upstream_connect_time_sum{addr="127.0.0.1:80"} 0.006
# HELP nginx_http_upstream_header_time HTTP upstream header time
# TYPE nginx_http_upstream_header_time histogram
nginx_http_upstream_header_time_bucket{addr="10.12.13.14:80",le="03.000"} 6
nginx_http_upstream_header_time_bucket{addr="10.12.13.14:80",le="04.000"} 6
nginx_http_upstream_header_time_bucket{addr="10.12.13.14:80",le="05.000"} 6
nginx_http_upstream_header_time_bucket{addr="10.12.13.14:80",le="10.000"} 6
nginx_http_upstream_header_time_bucket{addr="10.12.13.14:80",le="+Inf"} 6
nginx_http_upstream_header_time_bucket{addr="127.0.0.1:80",le="00.005"} 30
nginx_http_upstream_header_time_bucket{addr="127.0.0.1:80",le="00.010"} 30
nginx_http_upstream_header_time_bucket{addr="127.0.0.1:80",le="00.020"} 30
nginx_http_upstream_header_time_bucket{addr="127.0.0.1:80",le="00.030"} 30
nginx_http_upstream_header_time_bucket{addr="127.0.0.1:80",le="00.050"} 30
nginx_http_upstream_header_time_bucket{addr="127.0.0.1:80",le="00.075"} 30
nginx_http_upstream_header_time_bucket{addr="127.0.0.1:80",le="00.100"} 30
nginx_http_upstream_header_time_bucket{addr="127.0.0.1:80",le="00.200"} 30
nginx_http_upstream_header_time_bucket{addr="127.0.0.1:80",le="00.300"} 30
nginx_http_upstream_header_time_bucket{addr="127.0.0.1:80",le="00.400"} 30
nginx_http_upstream_header_time_bucket{addr="127.0.0.1:80",le="00.500"} 30
nginx_http_upstream_header_time_bucket{addr="127.0.0.1:80",le="00.750"} 30
nginx_http_upstream_header_time_bucket{addr="127.0.0.1:80",le="01.000"} 30
nginx_http_upstream_header_time_bucket{addr="127.0.0.1:80",le="01.500"} 30
nginx_http_upstream_header_time_bucket{addr="127.0.0.1:80",le="02.000"} 30
nginx_http_upstream_header_time_bucket{addr="127.0.0.1:80",le="03.000"} 30
nginx_http_upstream_header_time_bucket{addr="127.0.0.1:80",le="04.000"} 30
nginx_http_upstream_header_time_bucket{addr="127.0.0.1:80",le="05.000"} 30
nginx_http_upstream_header_time_bucket{addr="127.0.0.1:80",le="10.000"} 30
nginx_http_upstream_header_time_bucket{addr="127.0.0.1:80",le="+Inf"} 30
nginx_http_upstream_header_time_count{addr="10.12.13.14:80"} 6
nginx_http_upstream_header_time_count{addr="127.0.0.1:80"} 30
nginx_http_upstream_header_time_sum{addr="10.12.13.14:80"} 12.015
nginx_http_upstream_header_time_sum{addr="127.0.0.1:80"} 0.03
# HELP nginx_http_upstream_requests Number of HTTP upstream requests
# TYPE nginx_http_upstream_requests counter
nginx_http_upstream_requests{addr="10.12.13.14:80",status="504"} 6
nginx_http_upstream_requests{addr="127.0.0.1:80",status="200"} 30
# HELP nginx_http_upstream_response_time HTTP upstream response time
# TYPE nginx_http_upstream_response_time histogram
nginx_http_upstream_response_time_bucket{addr="10.12.13.14:80",le="03.000"} 6
nginx_http_upstream_response_time_bucket{addr="10.12.13.14:80",le="04.000"} 6
nginx_http_upstream_response_time_bucket{addr="10.12.13.14:80",le="05.000"} 6
nginx_http_upstream_response_time_bucket{addr="10.12.13.14:80",le="10.000"} 6
nginx_http_upstream_response_time_bucket{addr="10.12.13.14:80",le="+Inf"} 6
nginx_http_upstream_response_time_bucket{addr="127.0.0.1:80",le="00.005"} 30
nginx_http_upstream_response_time_bucket{addr="127.0.0.1:80",le="00.010"} 30
nginx_http_upstream_response_time_bucket{addr="127.0.0.1:80",le="00.020"} 30
nginx_http_upstream_response_time_bucket{addr="127.0.0.1:80",le="00.030"} 30
nginx_http_upstream_response_time_bucket{addr="127.0.0.1:80",le="00.050"} 30
nginx_http_upstream_response_time_bucket{addr="127.0.0.1:80",le="00.075"} 30
nginx_http_upstream_response_time_bucket{addr="127.0.0.1:80",le="00.100"} 30
nginx_http_upstream_response_time_bucket{addr="127.0.0.1:80",le="00.200"} 30
nginx_http_upstream_response_time_bucket{addr="127.0.0.1:80",le="00.300"} 30
nginx_http_upstream_response_time_bucket{addr="127.0.0.1:80",le="00.400"} 30
nginx_http_upstream_response_time_bucket{addr="127.0.0.1:80",le="00.500"} 30
nginx_http_upstream_response_time_bucket{addr="127.0.0.1:80",le="00.750"} 30
nginx_http_upstream_response_time_bucket{addr="127.0.0.1:80",le="01.000"} 30
nginx_http_upstream_response_time_bucket{addr="127.0.0.1:80",le="01.500"} 30
nginx_http_upstream_response_time_bucket{addr="127.0.0.1:80",le="02.000"} 30
nginx_http_upstream_response_time_bucket{addr="127.0.0.1:80",le="03.000"} 30
nginx_http_upstream_response_time_bucket{addr="127.0.0.1:80",le="04.000"} 30
nginx_http_upstream_response_time_bucket{addr="127.0.0.1:80",le="05.000"} 30
nginx_http_upstream_response_time_bucket{addr="127.0.0.1:80",le="10.000"} 30
nginx_http_upstream_response_time_bucket{addr="127.0.0.1:80",le="+Inf"} 30
nginx_http_upstream_response_time_count{addr="10.12.13.14:80"} 6
nginx_http_upstream_response_time_count{addr="127.0.0.1:80"} 30
nginx_http_upstream_response_time_sum{addr="10.12.13.14:80"} 12.015
nginx_http_upstream_response_time_sum{addr="127.0.0.1:80"} 0.03
# HELP nginx_metric_errors_total Number of nginx-lua-prometheus errors
# TYPE nginx_metric_errors_total counter
nginx_metric_errors_total 0
3. 驗證
訪問Prometheus,驗證數據採集,打開Status下的Service Discovery,active的數目等於Pod數據即表示採集正常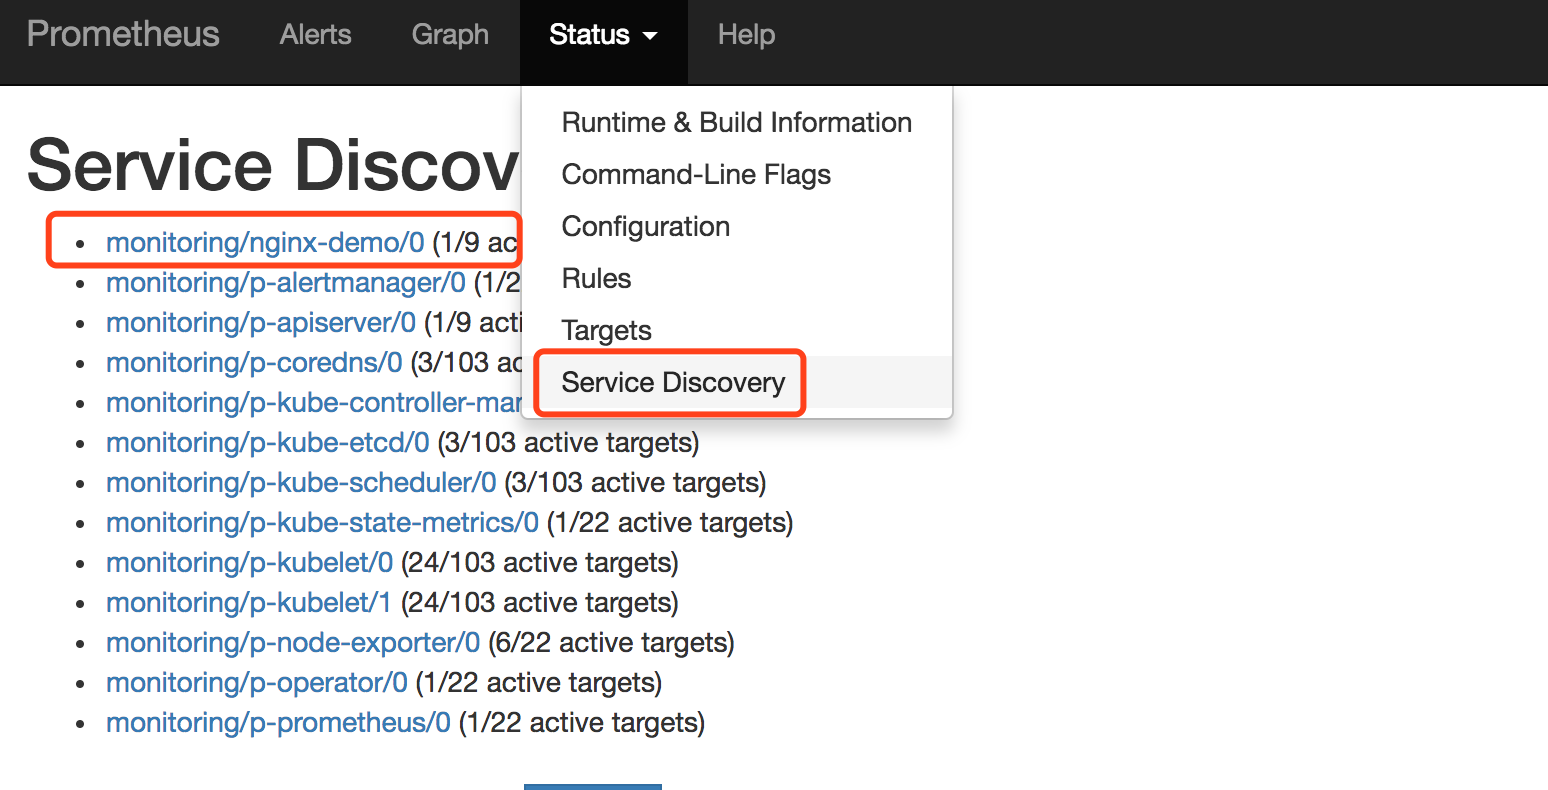
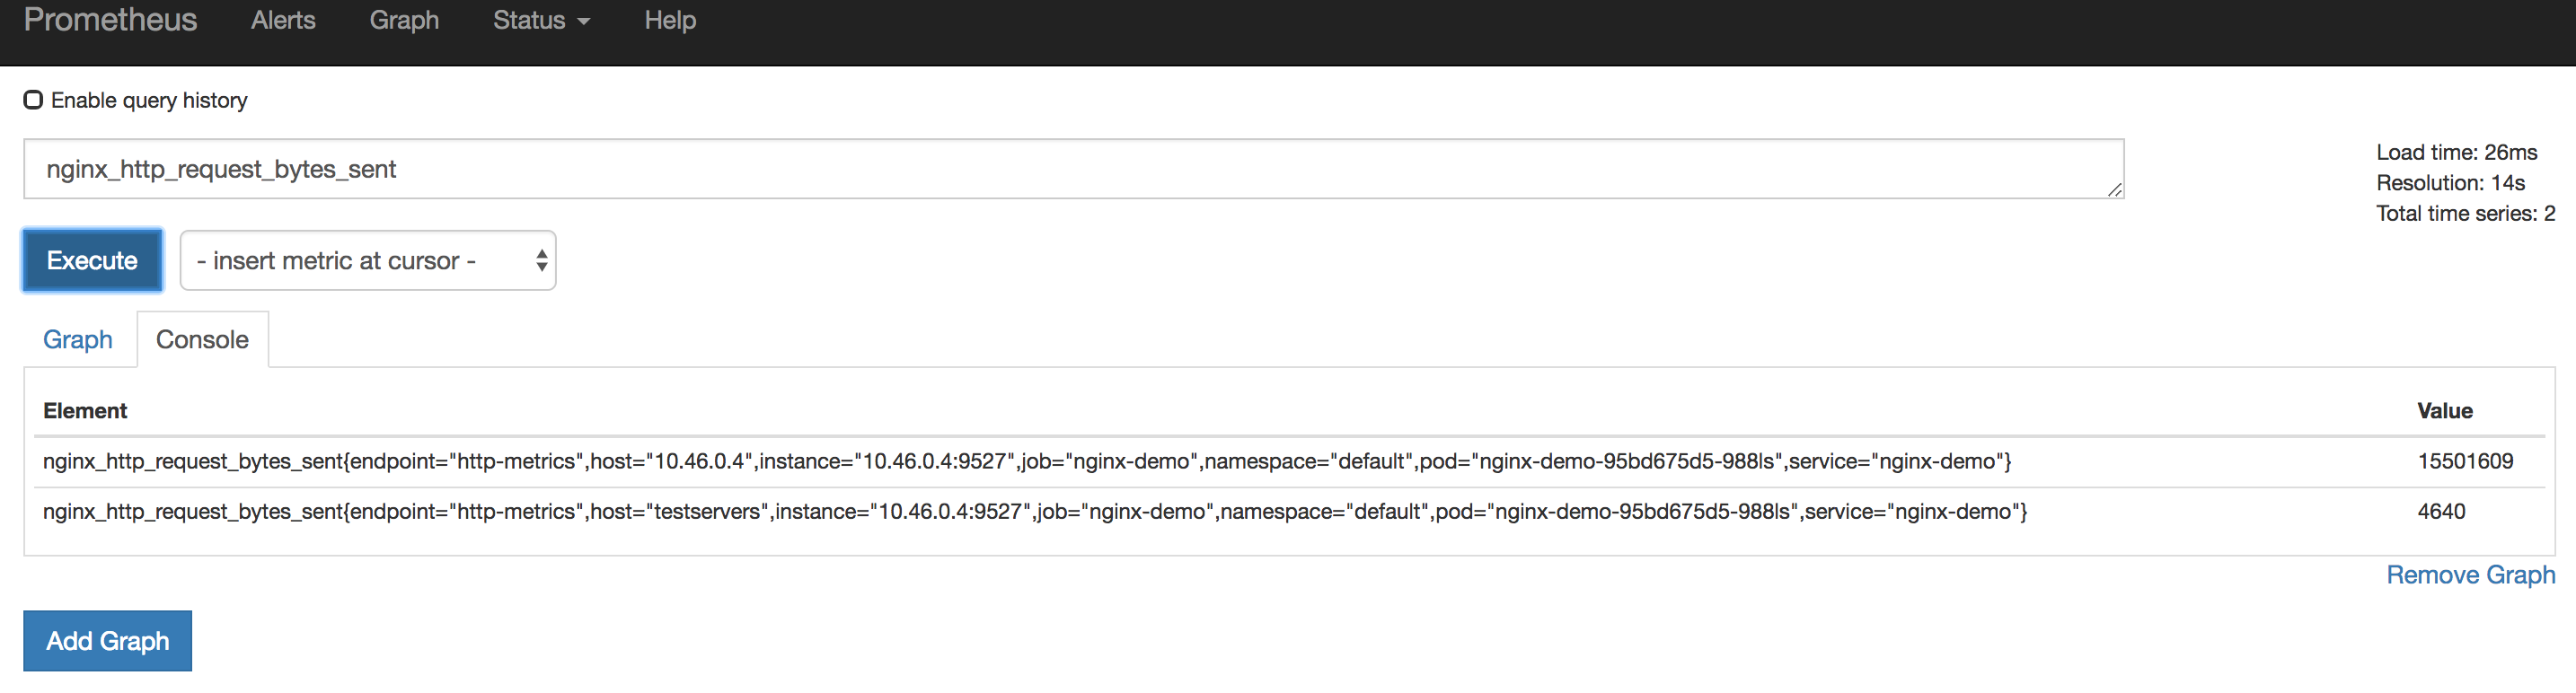
打開Graph頁面,選擇我們剛纔推送的數據指標名稱,點擊Execute,即可查看到採集上來的數據。prometheus查詢語法請參考prometheus查詢語句示例。
然後我們在grafana中創建一個簡單的圖表顯示nginx的數據。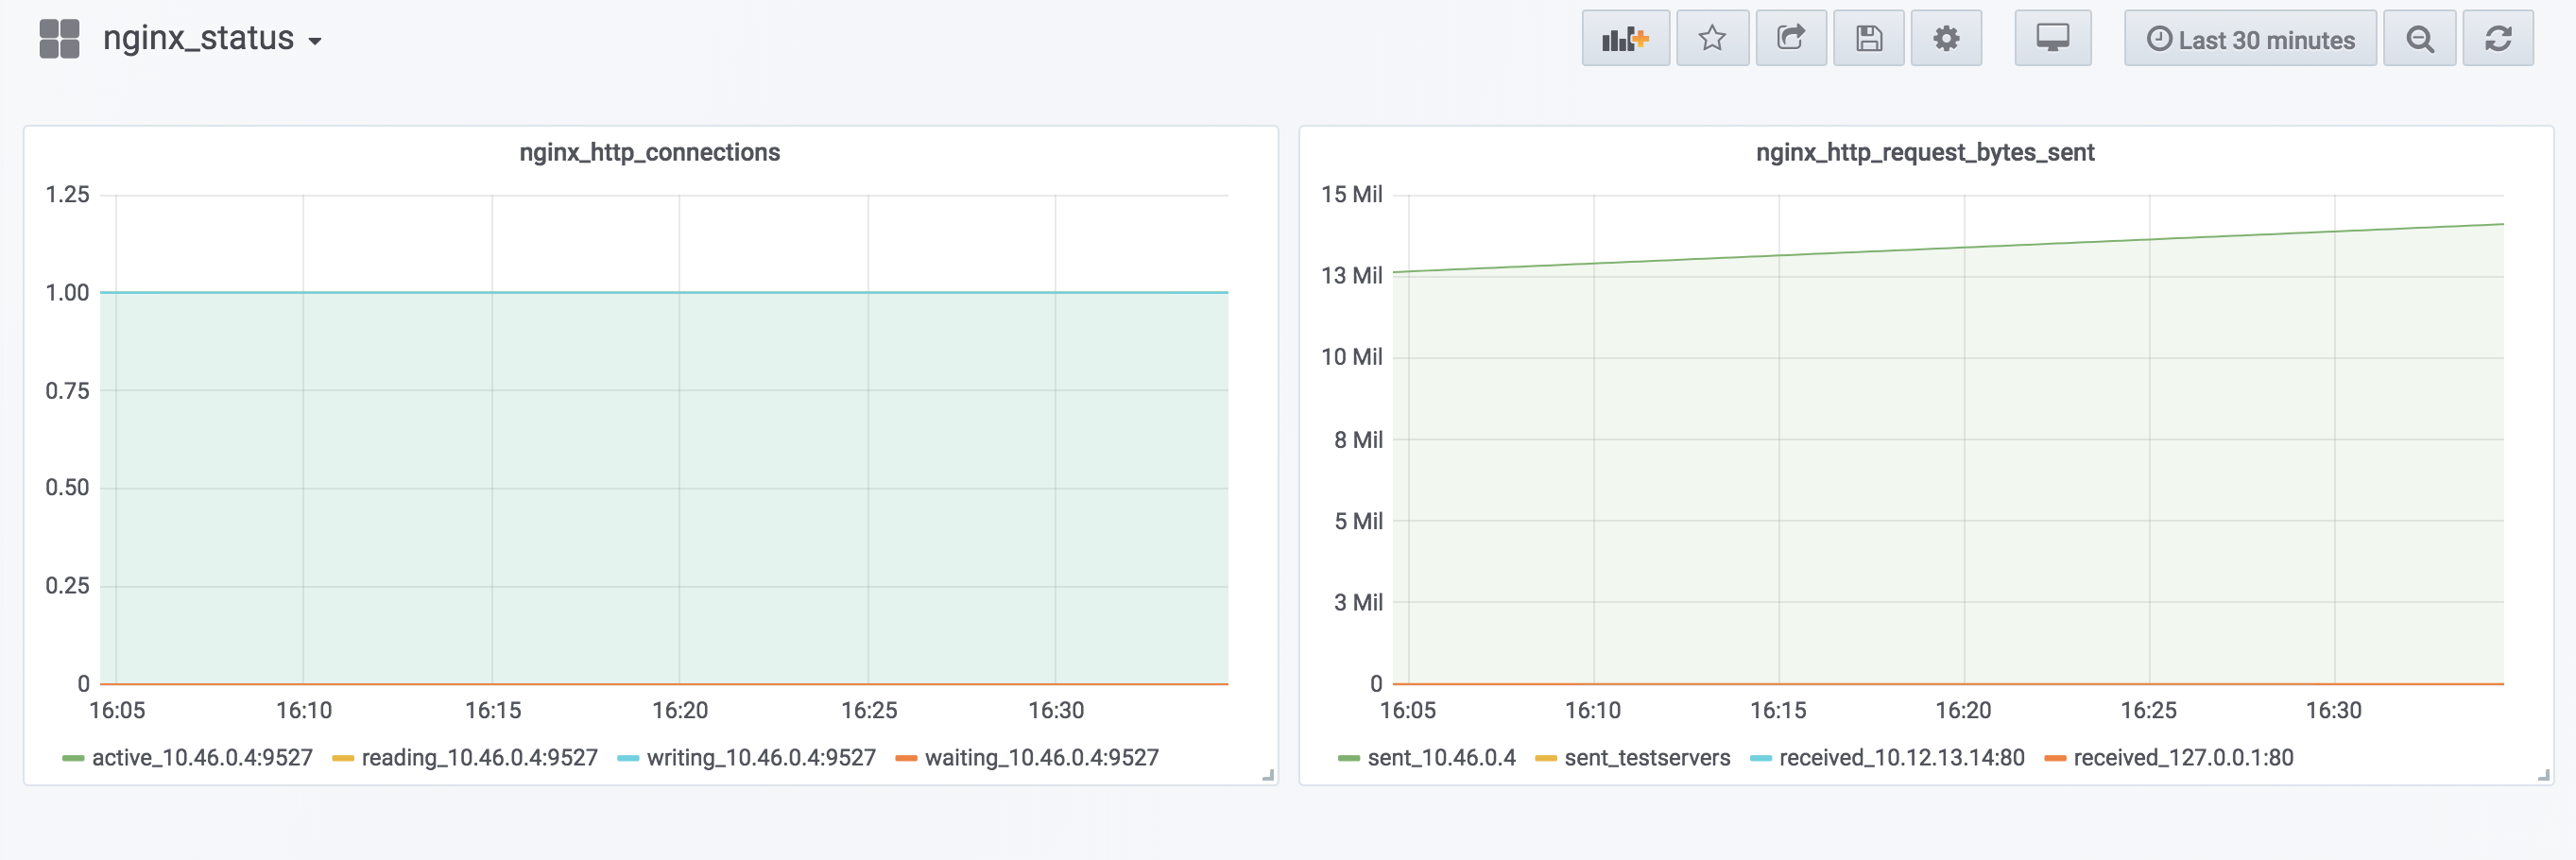
最後
使用Prometheus接入應用監控的方式非常簡單,整個操作的流程非常kubernetes,這也是目前非常多的開源軟件和Kubernetes集成的一種方式與趨勢,在開發者習慣了之後,會越來越感受到這種方式的便利。
下一篇會講到使用郵件或者釘釘報警的相關教程。
如有問題歡迎在下面留言交流。希望大家多多關注和點贊,謝謝!