


有三个值。分别是5秒,1分钟,5分钟的平均值,snmpget一下跟sh proc cpu命令对比下:
OID:.1.3.6.1.4.1.9.2.1.56
(.iso.org.dod.internet.private.enterprises.cisco.local.lsystem.busyPer)
描述: "CPU busy percentage in the last 5 second period. Not the last 5 realtime seconds but the last 5 second period in the scheduler."
OID:.1.3.6.1.4.1.9.2.1.57
(.iso.org.dod.internet.private.enterprises.cisco.local.lsystem.avgBusy1)
描述: "1 minute exponentially-decayed moving average of the CPU busy percentage."
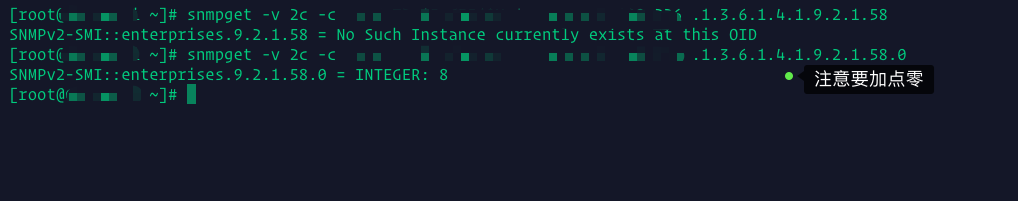
OID:.1.3.6.1.4.1.9.2.1.58
(.iso.org.dod.internet.private.enterprises.cisco.local.lsystem.avgBusy5)
描述: "5 minute exponentially-decayed moving average of the CPU busy percentage."
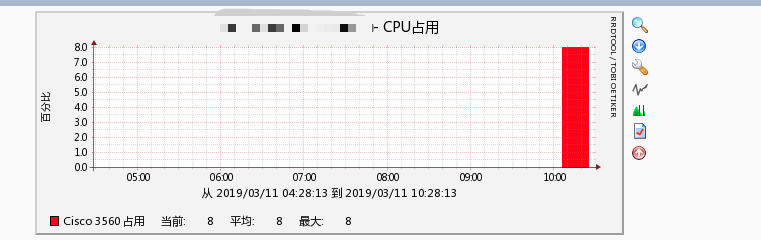
#sh processes cpu
CPU utilization for five seconds: 18%/0%; one minute: 9%; five minutes: 9%
内存是.1.3.6.1.4.1.9.2.1.8
iso.org.dod.internet.private.enterprises.cisco.local.lsystem.freeMem
"Return the amount of free memory in bytes."


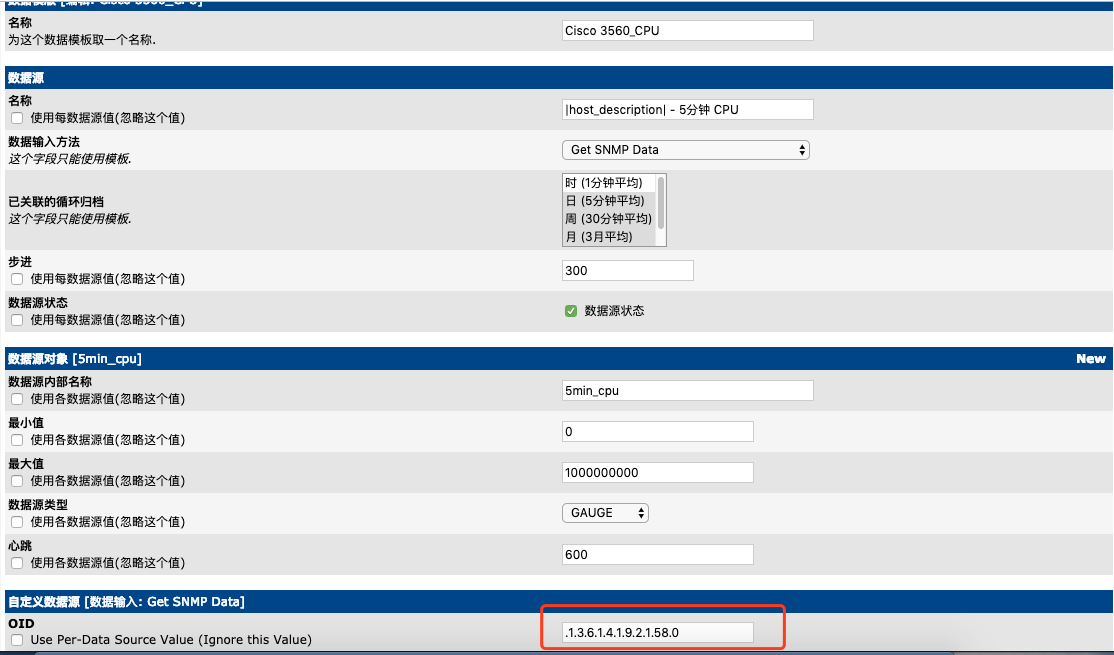


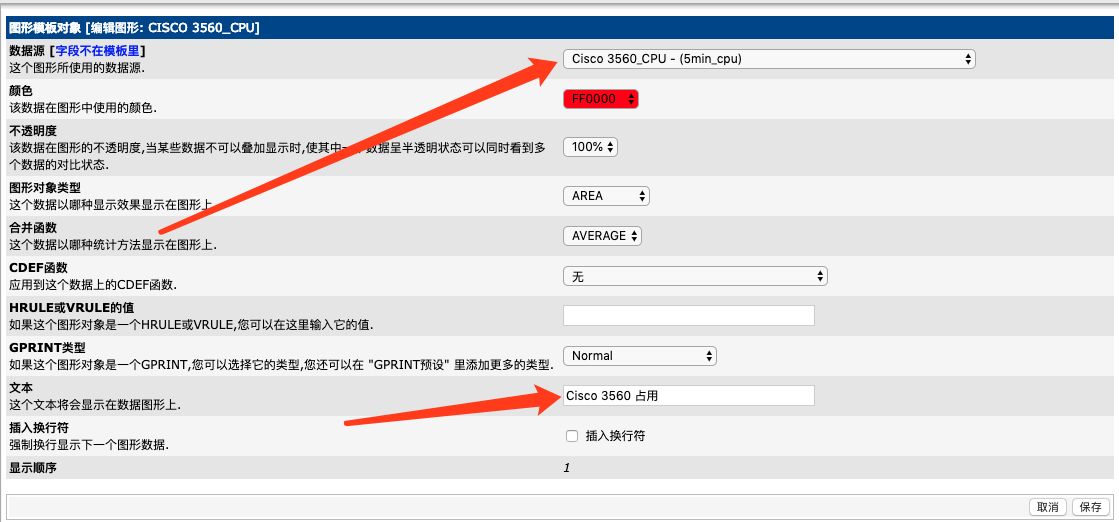
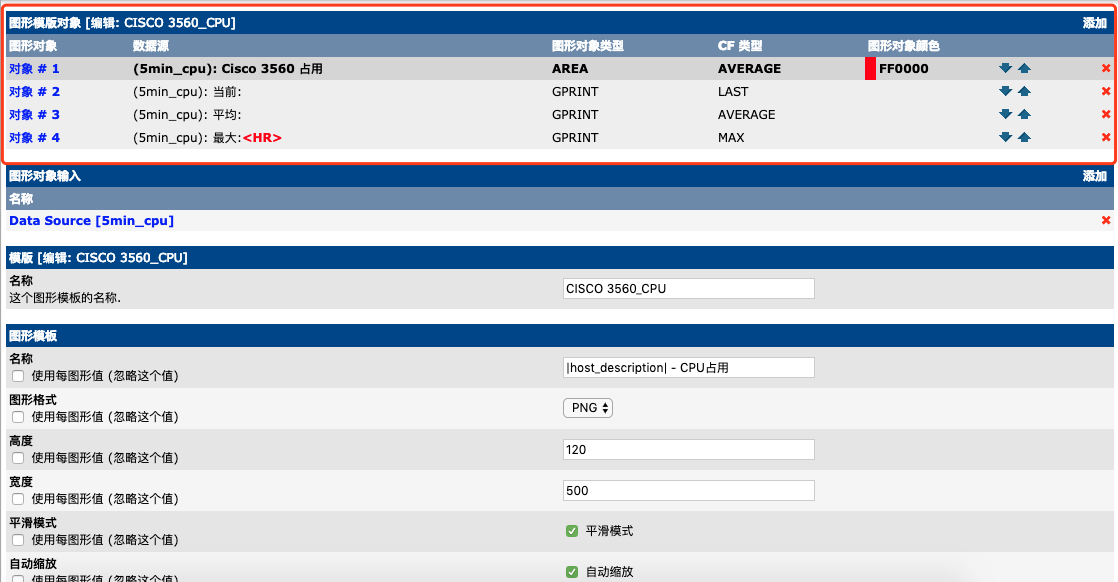
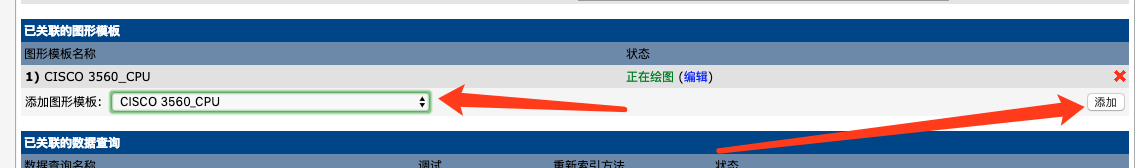
然后编辑主机,添加图形
内存的监控方法差不多,这里就不在演示了。