


前言:
測試環境:Ubuntu16.04 + Kernel:4.4.0-31
系統級性能優化通常包括兩個階段:性能剖析(performance profiling)和 代碼優化。
性能剖析的目標是尋找性能瓶頸,查找引發性能問題的原因及熱點代碼。
代碼優化的目標是針對具體性能問題而優化代碼或編譯選項,以改善軟件性能。
在性能剖析階段,需要藉助於現有的profiling工具,如perf、async-profiler(Java性能分析工具)等。在代碼優化階段往往需要藉助開發者的經驗,編寫簡潔高效的代碼,甚至在彙編級別合理使用各種指令,合理安排各種指令的執行順序。
perf 是一款Linux性能分析工具。Linux 性能計數器是一個新的基於內核的子系統,它提供一個性能分析框架,比如硬件(CPU、PMU(Performance Monitoring Unit))功能和軟件(軟件計數器、tracepoint)功能。
通過perf,應用程序可以利用PMU、tracepoint和內核中的計數器來進行性能統計。它不但可以分析制定應用程序的性能問題(per thread),也可以用來分析內核的性能問題,當然也可以同事分析應用程序和內核,從而全面理解應用程序中的性能瓶頸。
使用perf,可以分析程序運行期間發生的硬件事件,比如instructions retired、processor clock cycles等;也可以分析軟件時間,比如page fault和進程切換。
perf 是一款綜合性分析工具,大到系統全局性性能,再小到進程線程級別,甚至到函數及彙編級別。
perf提供了十八般武器,可以拿大刀大卸八塊,也可以拿起手術刀細緻分析。
1. 背景知識
1.1 tracepoints
tracepoints是散落在內核源碼中的一些hook,它們可以在特定的代碼被執行到時觸發,這一特定可以被各種trace/debug工具所使用。
perf將tracepoint產生的時間記錄下來,生成報告,通過分析這些報告,條有人緣便可以瞭解程序運行期間內核的各種細節,對性能症狀做出準確的診斷。
這些tracepint的對應的sysfs節點在/sys/kernel/debug/tracing/events目錄下。
1.2 硬件特性之cache
內存讀寫是很快的,但是還是無法和處理器指令執行速度相比。爲了從內存中讀取指令和數據,處理器需要等待,用處理器時間來衡量,這種等待非常漫長。cache是一種SRAM,讀寫速度非常快,能和處理器相匹配。因此將常用的數據保存在cache中,處理器便無需等待,從而提高性能。cache的尺寸一般都很小,充分利用cache是軟件調優非常重要部分。
2. 主要關注點
基於性能分析,可以進行算法優化(空間複雜度和時間複雜度權衡)、代碼優化(提高執行速度、減少內存佔用)。
評估程序對硬件資源的使用情況,例如各級cache的訪問次數、各級cache的丟失次數、流水線停頓週期、前端總線訪問次數等。
評估程序對操作系統資源的使用情況,系統調用次數、上下文切換次數、任務遷移次數。
事件可以分爲三種:
- Hardware Event由PMU部件產生,在特定的條件下探測性能事件是否發生以及發生的次數。比如cache命中。
- Software Event是內核產生的事件,分佈在各個功能模塊中,統計和操作系統相關性能事件。比如進程切換,tick數等。
-
Tracepoint Event是內核中靜態tracepoint所觸發的事件,這些tracepoint用來判斷程序運行期間內核的行爲細節,比如slab分配器的分配次數等。
3. perf的使用
perf --help 之後可以看到 perf 的二級命令。
| 序號 | 命令 | 作用 |
| 1 | annotate | 解析perf record生成的perf.data文件,顯示被註釋的代碼。 |
| 2 | archive | 根據數據文件記錄的build-id,將所有被採樣到的elf文件打包。利用此壓縮包,可以再任何機器上分析數據文件中記錄的採樣數據。 |
| 3 | bench | perf中內置的benchmark,目前包括兩套針對調度器和內存管理子系統的benchmark。 |
| 4 | buildid-cache | 管理perf的buildid緩存,每個elf文件都有一個獨一無二的buildid。buildid被perf用來關聯性能數據與elf文件。 |
| 5 | buildid-list | 列出數據文件中記錄的所有buildid。 |
| 6 | diff | 對比兩個數據文件的差異。能夠給出每個符號(函數)在熱點分析上的具體差異。 |
| 7 | evlist | 列出數據文件perf.data中所有性能事件。 |
| 8 | inject | 該工具讀取perf record工具記錄的事件流,並將其定向到標準輸出。在被分析代碼中的任何一點,都可以向事件流中注入其它事件。 |
| 9 | kmem | 針對內核內存(slab)子系統進行追蹤測量的工具 |
| 10 | kvm | 用來追蹤測試運行在KVM虛擬機上的Guest OS。 |
| 11 | list | 列出當前系統支持的所有性能事件。包括硬件性能事件、軟件性能事件以及檢查點。 |
| 12 | lock | 分析內核中的鎖信息,包括鎖的爭用情況,等待延遲等。 |
| 13 | mem | 內存存取情況 |
| 14 | record | 收集採樣信息,並將其記錄在數據文件中。隨後可通過其它工具對數據文件進行分析。 |
| 15 | report | 讀取perf record創建的數據文件,並給出熱點分析結果。 |
| 16 | sched | 針對調度器子系統的分析工具。 |
| 17 | script | 執行perl或python寫的功能擴展腳本、生成腳本框架、讀取數據文件中的數據信息等。 |
| 18 | stat | 執行某個命令,收集特定進程的性能概況,包括CPI、Cache丟失率等。並將收集信息保存到CSV(Comma-Separated Values)文件中。 |
| 19 | test | perf對當前軟硬件平臺進行健全性測試,可用此工具測試當前的軟硬件平臺是否能支持perf的所有功能。 |
| 20 | timechart | 針對測試期間系統行爲進行可視化的工具 |
| 21 | top | 類似於linux的top命令,對系統性能進行實時分析。 |
| 22 | trace | 關於syscall的工具。 |
| 23 | probe | 用於定義動態檢查點。 |
全局性概況:
perf list 查看當前系統支持的性能事件;
perf bench 對系統性能進行摸底;
perf test 對系統進行健全性測試;
perf stat 對全局性能進行統計;
全局細節:
perf top 可以實時查看當前系統進程函數佔用率情況;
perf probe 可以自定義動態事件;
特定功能分析:
perf kmem針對slab子系統性能分析;
perf kvm針對kvm虛擬化分析;
perf lock分析鎖性能;
perf mem分析內存slab性能;
perf sched分析內核調度器性能;
perf trace記錄系統調用軌跡;
最常用功能perf record,可以系統全局,也可以具體到某個進程,更甚具體到某一進程某一事件;可宏觀,也可以很微觀。
pref record 記錄信息到perf.data;
perf report 生成報告;
perf diff 對兩個記錄進行diff;
perf evlist 列出記錄的性能事件;
perf annotate 顯示perf.data函數代碼;
perf archive 將相關符號打包,方便在其它機器進行分析;
perf script 將perf.data輸出可讀性文本;
可視化工具perf timechart
perf timechart record 記錄事件;
perf timechart 生成output.svg文檔;
3.0 perf 引入的 overhead
perf 測試不可避免的會引入額外負荷,有三種形式:
counting:內核提供計數總結,多是Hardware Event、Software Events、PMU計數等。相關命令perf stat。
sampling:perf將事件數據緩存到一塊buffer中,然後異步寫入到perf.data文件中。使用perf report等工具進行離線分析。
bpf:Kernel 4.4+新增功能,可以提供更多有效filter和輸出總結。
counting引入的額外負荷最小;sampling在某些情況下會引入非常大的負荷;bpf可以有效縮減負荷。
針對sampling,可以通過掛在建立在RAM上的文件系統來有效降低讀寫I/O引入的負荷。
mkdir /tmpfs
mount -t tmpfs tmpfs /tmpfs
3.1 perf list
perf list不能完全顯示所有支持的事件類型,需要sudo perf list。
同時還可以顯示特定模塊支持的perf事件:hw/cache/pmu都是硬件相關的;tracepoint基於內核的ftrace;sw實際上是內核計數器。
hw/hardware顯示支持的硬件事件相關,如:
al@al-System-Product-Name:~/perf$ sudo perf list hardware
List of pre-defined events (to be used in -e):
branch-instructions OR branches [Hardware event]
branch-misses [Hardware event]
cache-misses [Hardware event]
cache-references [Hardware event]
cpu-cycles OR cycles [Hardware event]
instructions [Hardware event]
stalled-cycles-backend OR idle-cycles-backend [Hardware event]
stalled-cycles-frontend OR idle-cycles-frontend [Hardware event]
sw/software顯示支持的軟件事件列表:
al@al-System-Product-Name:~/perf$ sudo perf list sw
List of pre-defined events (to be used in -e):
alignment-faults [Software event]
bpf-output [Software event]
context-switches OR cs [Software event]
cpu-clock [Software event]
cpu-migrations OR migrations [Software event]
dummy [Software event]
emulation-faults [Software event]
major-faults [Software event]
minor-faults [Software event]
page-faults OR faults [Software event]
task-clock [Software event]
cache/hwcache顯示硬件cache相關事件列表:
al@al-System-Product-Name:~/perf$ sudo perf list cache
List of pre-defined events (to be used in -e):
L1-dcache-load-misses [Hardware cache event]
L1-dcache-loads [Hardware cache event]
L1-dcache-prefetch-misses [Hardware cache event]
L1-dcache-prefetches [Hardware cache event]
L1-icache-load-misses [Hardware cache event]
L1-icache-loads [Hardware cache event]
L1-icache-prefetches [Hardware cache event]
LLC-load-misses [Hardware cache event]
LLC-loads [Hardware cache event]
LLC-stores [Hardware cache event]
branch-load-misses [Hardware cache event]
branch-loads [Hardware cache event]
dTLB-load-misses [Hardware cache event]
dTLB-loads [Hardware cache event]
iTLB-load-misses [Hardware cache event]
iTLB-loads [Hardware cache event]
node-load-misses [Hardware cache event]
node-loads [Hardware cache event]
pmu顯示支持的PMU事件列表:
al@al-System-Product-Name:~/perf$ sudo perf list pmu
List of pre-defined events (to be used in -e):
branch-instructions OR cpu/branch-instructions/ [Kernel PMU event]
branch-misses OR cpu/branch-misses/ [Kernel PMU event]
cache-misses OR cpu/cache-misses/ [Kernel PMU event]
cache-references OR cpu/cache-references/ [Kernel PMU event]
cpu-cycles OR cpu/cpu-cycles/ [Kernel PMU event]
instructions OR cpu/instructions/ [Kernel PMU event]
msr/aperf/ [Kernel PMU event]
msr/mperf/ [Kernel PMU event]
msr/tsc/ [Kernel PMU event]
stalled-cycles-backend OR cpu/stalled-cycles-backend/ [Kernel PMU event]
stalled-cycles-frontend OR cpu/stalled-cycles-frontend/ [Kernel PMU event]
tracepoint顯示支持的所有tracepoint列表,這個列表就比較龐大:
al@al-System-Product-Name:~/perf$ sudo perf list tracepoint
List of pre-defined events (to be used in -e):
alarmtimer:alarmtimer_cancel [Tracepoint event]
alarmtimer:alarmtimer_fired [Tracepoint event]
alarmtimer:alarmtimer_start [Tracepoint event]
alarmtimer:alarmtimer_suspend [Tracepoint event]
block:block_bio_backmerge [Tracepoint event]
block:block_bio_bounce [Tracepoint event]
block:block_bio_complete [Tracepoint event]
block:block_bio_frontmerge [Tracepoint event]
block:block_bio_queue [Tracepoint event]…
3.2 perf top
默認情況下perf top是無法顯示信息的,需要sudo perf top或者echo -1 > /proc/sys/kernel/perf_event_paranoid(在Ubuntu16.04,還需要echo 0 > /proc/sys/kernel/kptr_restrict)。
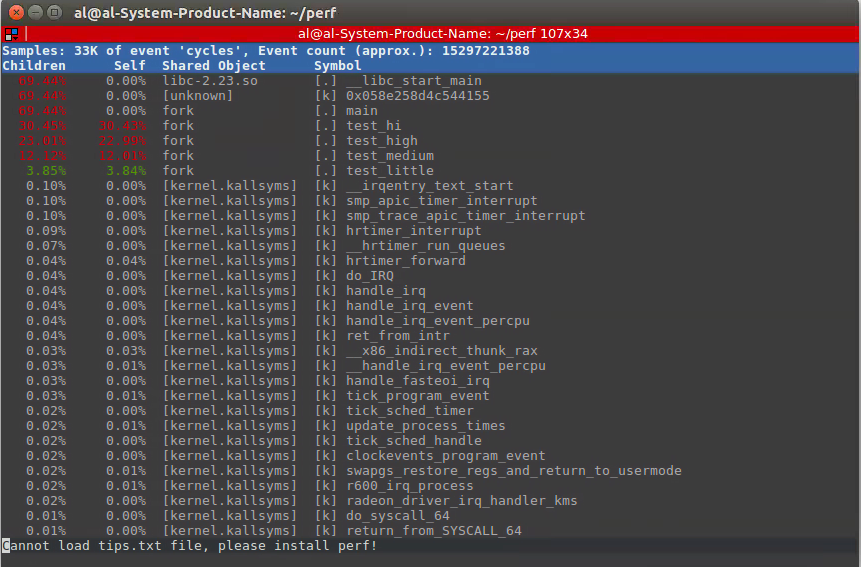
即可以正常顯示perf top如下:
第一列:符號引發的性能事件的比例,指佔用的cpu週期比例。
第二列:符號所在的DSO(Dynamic Shared Object),可以是應用程序、內核、動態鏈接庫、模塊。
第三列:DSO的類型。[.]表示此符號屬於用戶態的ELF文件,包括可執行文件與動態鏈接庫;[k]表述此符號屬於內核或模塊。
第四列:符號名。有些符號不能解析爲函數名,只能用地址表示。

關於perf top界面常用命令如下:
h:顯示幫助,即可顯示詳細的幫助信息。
UP/DOWN/PGUP/PGDN/SPACE:上下和翻頁。
a:annotate current symbol,註解當前符號。能夠給出彙編語言的註解,給出各條指令的採樣率。
d:過濾掉所有不屬於此DSO的符號。非常方便查看同一類別的符號。
P:將當前信息保存到perf.hist.N中。
perf top常用選項有:
-e <event>:指明要分析的性能事件。
-p <pid>:Profile events on existing Process ID (comma sperated list). 僅分析目標進程及其創建的線程。
-k <path>:Path to vmlinux. Required for annotation functionality. 帶符號表的內核映像所在的路徑。
-K:不顯示屬於內核或模塊的符號。
-U:不顯示屬於用戶態程序的符號。
-d <n>:界面的刷新週期,默認爲2s,因爲perf top默認每2s從mmap的內存區域讀取一次性能數據。
-g:得到函數的調用關係圖。
perf top --call-graph [fractal],路徑概率爲相對值,加起來爲100%,調用順序爲從下往上。
perf top --call-graph graph,路徑概率爲絕對值,加起來爲該函數的熱度。

3.3 perf stat
perf stat 用於運行指令,並分析其統計結果。雖然perf top也可以指定pid,但是必須先啓動應用才能查看信息。
perf stat 能完整統計應用整個生命週期的信息。
命令格式爲:
perf stat [-e <EVENT> | --event=EVENT] [-a] <command>
perf stat [-e <EVENT> | --event=EVENT] [-a] -- <command> [<options>]
下面簡單看一下perf stat 的輸出:
al@al-System-Product-Name:~/perf$ sudo perf stat
^C
Performance counter stats for 'system wide':40904.820871 cpu-clock (msec) # 5.000 CPUs utilized
18,132 context-switches # 0.443 K/sec
1,053 cpu-migrations # 0.026 K/sec
2,420 page-faults # 0.059 K/sec
3,958,376,712 cycles # 0.097 GHz (49.99%)
574,598,403 stalled-cycles-frontend # 14.52% frontend cycles idle (49.98%)
9,392,982,910 stalled-cycles-backend # 237.29% backend cycles idle (50.00%)
1,653,185,883 instructions # 0.42 insn per cycle
# 5.68 stalled cycles per insn (50.01%)
237,061,366 branches # 5.795 M/sec (50.02%)
18,333,168 branch-misses # 7.73% of all branches (50.00%)8.181521203 seconds time elapsed
perf stat 輸出的數據如下:
cpu-clock:任務真正佔用的處理器時間,單位爲ms。
CPUs utilized = task-clock / time elapsed,CPU的佔用率。
context-switches:程序在運行過程中上下文的切換次數。
CPU-migrations:程序在運行過程中發生的處理器遷移次數。Linux爲了維持多個處理器的負載均衡,在特定條件下會將某個任務從一個CPU遷移到另一個CPU。
CPU遷移和上下文切換:發生上下文切換不一定會發生CPU遷移,而發生CPU遷移時肯定會發生上下文切換。發生上下文切換有可能只是把上下文從當前CPU中換出,下一次調度器還是將進程安排在這個CPU上執行。
page-faults:缺頁異常的次數。當應用程序請求的頁面尚未建立、請求的頁面不在內存中,或者請求的頁面雖然在內存中,但物理地址和虛擬地址的映射關係尚未建立時,都會觸發一次缺頁異常。另外TLB不命中,頁面訪問權限不匹配等情況也會觸發缺頁異常。
cycles:消耗的處理器週期數。如果把被ls使用的cpu cycles看成是一個處理器的,那麼它的主頻爲2.486GHz。可以用cycles / task-clock算出。
stalled-cycles-frontend:指令讀取或解碼的質量步驟,未能按理想狀態發揮並行左右,發生停滯的時鐘週期。
stalled-cycles-backend:指令執行步驟,發生停滯的時鐘週期。
instructions:執行了多少條指令。IPC爲平均每個cpu cycle執行了多少條指令。
branches:遇到的分支指令數。branch-misses是預測錯誤的分支指令數。
其他常用參數
-a, --all-cpus system-wide collection from all CPUs #顯示所有CPU上的統計信息
-C, --cpu <cpu> list of cpus to monitor in system-wide #顯示指定CPU的統計信息
-c, --scale scale/normalize counters
-D, --delay <n> ms to wait before starting measurement after program start
-d, --detailed detailed run - start a lot of events
-e, --event <event> event selector. use 'perf list' to list available events #監控的事件類型
-G, --cgroup <name> monitor event in cgroup name only
-g, --group put the counters into a counter group
-I, --interval-print <n> #打印的時間間隔
print counts at regular interval in ms (>= 10)
-i, --no-inherit child tasks do not inherit counters
-n, --null null run - dont start any counters
-o, --output <file> output file name #輸出統計信息到文件
-p, --pid <pid> stat events on existing process id
-r, --repeat <n> repeat command and print average + stddev (max: 100, forever: 0)
-S, --sync call sync() before starting a run
-t, --tid <tid> stat events on existing thread id
-T, --transaction hardware transaction statistics
-v, --verbose be more verbose (show counter open errors, etc)
-x, --field-separator <separator>
print counts with custom separator #設置打印的分隔符
--append append to the output file
--filter <filter>
event filter
--log-fd <n> log output to fd, instead of stderr
--metric-only Only print computed metrics. No raw values
--no-merge Do not merge identical named events
--per-core aggregate counts per physical processor core
--per-socket aggregate counts per processor socket
--per-thread aggregate counts per thread
--post <command> command to run after to the measured command
--pre <command> command to run prior to the measured command
--smi-cost measure SMI cost
--topdown measure topdown level 1 statisticssleep [num] #例如,sleep 10 , 統計10秒
示例
前面統計程序的示例,下面看一下統計CPU信息的示例:
執行sudo perf stat -C 0,統計CPU 0的信息。想要停止後,按下Ctrl+C終止。可以看到統計項一樣,只是統計對象變了。
al@al-System-Product-Name:~/perf$ sudo perf stat -C 0
^C
Performance counter stats for 'CPU(s) 0':2517.107315 cpu-clock (msec) # 1.000 CPUs utilized
2,941 context-switches # 0.001 M/sec
109 cpu-migrations # 0.043 K/sec
38 page-faults # 0.015 K/sec
644,094,340 cycles # 0.256 GHz (49.94%)
70,425,076 stalled-cycles-frontend # 10.93% frontend cycles idle (49.94%)
965,270,543 stalled-cycles-backend # 149.86% backend cycles idle (49.94%)
623,284,864 instructions # 0.97 insn per cycle
# 1.55 stalled cycles per insn (50.06%)
65,658,190 branches # 26.085 M/sec (50.06%)
3,276,104 branch-misses # 4.99% of all branches (50.06%)2.516996126 seconds time elapsed
如果需要統計更多的項,需要使用-e,如:
| perf stat -e task-clock,context-switches,cpu-migrations,page-faults,cycles,stalled-cycles-frontend,stalled-cycles-backend,instructions,branches,branch-misses,L1-dcache-loads,L1-dcache-load-misses,LLC-loads,LLC-load-misses,dTLB-loads,dTLB-load-misses ls |
結果如下,關注的特殊項也納入統計。
al@al-System-Product-Name:~/perf$ sudo perf stat -e task-clock,context-switches,cpu-migrations,page-faults,cycles,stalled-cycles-frontend,stalled-cycles-backend,instructions,branches,branch-misses,L1-dcache-loads,L1-dcache-load-misses,LLC-loads,LLC-load-misses,dTLB-loads,dTLB-load-misses ls
Performance counter stats for 'ls':
2.319422 task-clock (msec) # 0.719 CPUs utilized
0 context-switches # 0.000 K/sec
0 cpu-migrations # 0.000 K/sec
89 page-faults # 0.038 M/sec
2,142,386 cycles # 0.924 GHz
659,800 stalled-cycles-frontend # 30.80% frontend cycles idle
725,343 stalled-cycles-backend # 33.86% backend cycles idle
1,344,518 instructions # 0.63 insn per cycle
# 0.54 stalled cycles per insn
<not counted> branches
<not counted> branch-misses
<not counted> L1-dcache-loads
<not counted> L1-dcache-load-misses
<not counted> LLC-loads
<not counted> LLC-load-misses
<not counted> dTLB-loads
<not counted> dTLB-load-misses0.003227507 seconds time elapsed
3.4 perf bench
perf bench作爲benchmark工具的通用框架,包含sched/mem/numa/futex等子系統,all可以指定所有。
perf bench可用於評估系統sched/mem等特定性能。
perf bench sched:調度器和IPC機制。包含messaging和pipe兩個功能。
perf bench mem:內存存取性能。包含memcpy和memset兩個功能。
perf bench numa:NUMA架構的調度和內存處理性能。包含mem功能。
perf bench futex:futex壓力測試。包含hash/wake/wake-parallel/requeue/lock-pi功能。
perf bench all:所有bench測試的集合
3.4.1 perf bench sched all
測試messaging和pipi兩部分性能。
3.4.1.1 sched messaging評估進程調度和核間通信
sched message 是從經典的測試程序 hackbench 移植而來,用來衡量調度器的性能,overhead 以及可擴展性。
該 benchmark 啓動 N 個 reader/sender 進程或線程對,通過 IPC(socket 或者 pipe) 進行併發的讀寫。一般人們將 N 不斷加大來衡量調度器的可擴展性。
sched message 的用法及用途和 hackbench 一樣,可以通過修改參數進行不同目的測試:
-g, --group <n> Specify number of groups
-l, --nr_loops <n> Specify the number of loops to run (default: 100)
-p, --pipe Use pipe() instead of socketpair()
-t, --thread Be multi thread instead of multi process
測試結果:
al@al-System-Product-Name:~/perf$ perf bench sched all
# Running sched/messaging benchmark...
# 20 sender and receiver processes per group
# 10 groups == 400 processes runTotal time: 0.173 [sec]
# Running sched/pipe benchmark...
# Executed 1000000 pipe operations between two processesTotal time: 12.233 [sec]
12.233170 usecs/op
81744 ops/sec
使用pipe()和socketpair()對測試影響:
1. perf bench sched messaging
# Running 'sched/messaging' benchmark:
# 20 sender and receiver processes per group
# 10 groups == 400 processes runTotal time: 0.176 [sec]
2. perf bench sched messaging -p# Running 'sched/messaging' benchmark:
# 20 sender and receiver processes per group
# 10 groups == 400 processes runTotal time: 0.093 [sec]
可見socketpair()性能要明顯低於pipe()。
3.4.1.2 sched pipe評估pipe性能
sched pipe 從 Ingo Molnar 的 pipe-test-1m.c 移植而來。當初 Ingo 的原始程序是爲了測試不同的調度器的性能和公平性的。
其工作原理很簡單,兩個進程互相通過 pipe 拼命地發 1000000 個整數,進程 A 發給 B,同時 B 發給 A。因爲 A 和 B 互相依賴,因此假如調度器不公平,對 A 比 B 好,那麼 A 和 B 整體所需要的時間就會更長。
al@al-System-Product-Name:~/perf$ perf bench sched pipe
# Running 'sched/pipe' benchmark:
# Executed 1000000 pipe operations between two processesTotal time: 12.240 [sec]
12.240411 usecs/op
81696 ops/sec
3.4.2 perf bench mem all
該測試衡量 不同版本的memcpy/memset/ 函數處理一個 1M 數據的所花費的時間,轉換成吞吐率。
al@al-System-Product-Name:~/perf$ perf bench mem all
# Running mem/memcpy benchmark...
# function 'default' (Default memcpy() provided by glibc)
# Copying 1MB bytes ...1.236155 GB/sec.
..
3.4.3 perf bench futex
Futex是一種用戶態和內核態混合機制,所以需要兩個部分合作完成,linux上提供了sys_futex系統調用,對進程競爭情況下的同步處理提供支持。
所有的futex同步操作都應該從用戶空間開始,首先創建一個futex同步變量,也就是位於共享內存的一個整型計數器。
當進程嘗試持有鎖或者要進入互斥區的時候,對futex執行"down"操作,即原子性的給futex同步變量減1。如果同步變量變爲0,則沒有競爭發生, 進程照常執行。
如果同步變量是個負數,則意味着有競爭發生,需要調用futex系統調用的futex_wait操作休眠當前進程。
當進程釋放鎖或 者要離開互斥區的時候,對futex進行"up"操作,即原子性的給futex同步變量加1。如果同步變量由0變成1,則沒有競爭發生,進程照常執行。
如果加之前同步變量是負數,則意味着有競爭發生,需要調用futex系統調用的futex_wake操作喚醒一個或者多個等待進程。
al@al-System-Product-Name:~/perf$ perf bench futex all
# Running futex/hash benchmark...
Run summary [PID 3806]: 5 threads, each operating on 1024 [private] futexes for 10 secs.[thread 0] futexes: 0x4003d20 ... 0x4004d1c [ 4635648 ops/sec ]
[thread 1] futexes: 0x4004d30 ... 0x4005d2c [ 4611072 ops/sec ]
[thread 2] futexes: 0x4005e70 ... 0x4006e6c [ 4254515 ops/sec ]
[thread 3] futexes: 0x4006fb0 ... 0x4007fac [ 4559360 ops/sec ]
[thread 4] futexes: 0x40080f0 ... 0x40090ec [ 4636262 ops/sec ]Averaged 4539371 operations/sec (+- 1.60%), total secs = 10
# Running futex/wake benchmark...
Run summary [PID 3806]: blocking on 5 threads (at [private] futex 0x96b52c), waking up 1 at a time.[Run 1]: Wokeup 5 of 5 threads in 0.0270 ms
[Run 2]: Wokeup 5 of 5 threads in 0.0370 ms...
3.4 perf record
運行一個命令,並將其數據保存到perf.data中。隨後,可以使用perf report進行分析。
perf record 和perf report 可以更精確的分析一個應用,perf record可以精確到函數級別。並且在函數裏面混合顯示彙編語言和代碼。
創建一個fork.c文件用於測試:
#include <stdio.h>

void test_little(void)
{
  int i,j;

  for(i = 0; i < 30000000; i++)
    j=i;
}

void test_mdedium(void)
{
  int i,j;

  for(i = 0; i < 60000000; i++)
    j=i;
}

void test_high(void)
{
  int i,j;

  for(i = 0; i < 90000000; i++)
    j=i;
}

void test_hi(void)
{
  int i,j;

  for(i = 0; i < 120000000; i++)
    j=i;
}

int main(void)
{
  int i, pid, result;

  for(i = 0; i<2; i++) {
    result = fork();
    if(result>0)
      printf("i=%d parent parent=%d current=%d child=%d\n", i, getppid(), getpid(), result);
    else
      printf("i=%d child parent=%d current=%d\n", i, getppid(), getpid());

    if(i==0)
    {
      test_little();
      sleep(1);
    } else {
      test_mdedium();
      sleep(1);
    }
  }

  pid = wait(NULL);
  test_high();
  printf("pid=%d wait=%d\n", getpid(), pid);
  sleep(1);
  pid = wait(NULL);
  test_hi();
  printf("pid=%d wait=%d\n", getpid(), pid);
  return 0;
}
編譯fork.c文件gcc fork.c -o fork-g -O0,同時可以使用此方法分析是否選擇編譯優化產生的結果。-g是隻能callgraph功能,-O0是關閉優化。
常用選項
-e record指定PMU事件
--filter event事件過濾器
-a 錄取所有CPU的事件-c:事件的採樣週期
-p 錄取指定pid進程的事件
-F, --freq=
Profile at this frequency. #按此頻率配置文件,例如:-F 99 99HZ採樣
-g 使能函數調用關係圖功能
-C 錄取指定CPU的事件-o:指定輸出文件,默認爲perf.data
-A:以append的方式寫輸出文件
-f:以OverWrite的方式寫輸出文件
sudo perf record -a -g ./fork:會在當前目錄生成perf.data文件。
sudo perf report --call-graph none結果如下,後面結合perf timechart分析.

上圖看上去比較亂,如果想只看fork產生的信息:
sudo perf report --call-graph none -c fork
可以看出只顯示了fork程序的相關符號及其佔用率。
3.5 perf report
解析perf record產生的數據,並給出分析結果。
常用參數:
-i 導入的數據文件名稱,如果沒有則默認爲perf.data
-g 生成函數調用關係圖,此時內核要打開CONFIG_KALLSYMS;用戶空間庫或者執行文件需要帶符號信息(not stripped),編譯選項需要加上-g。
--sort 從更高層面顯示分類統計信息,比如: pid, comm, dso, symbol, parent, cpu,socket, srcline, weight, local_weight.
執行sudo perf report -i perf.data,可以看出main函數所佔百分比,以及funcA和funcB分別所佔百分比。
在funcB執行過程中,還產生了apic timer,佔用了一部分cpu資源。除此之外,佔比基本上是1:10。

funcA和funcB的佔比,基本符合預期。那麼進入longa,分析一下熱點。
在C和彙編混合顯示界面,可以看出for循環佔用了69.92%,j=i賦值佔用了30.08%。

根據之上描述,可以看出top適合監控整個系統的性能,stat比較適合單個程序的性能分析,record/report更適合對程序進行更細粒度的分析。
注意點:
在使用perf report -g的時候,可能會提示Failed to open /lib/libpthread-0.9.33.2.so, continuing without symbols。
這時候通過file xxx查看,如果提示xxxx stripped表示此文件不包含符號信息,需要xxxx not stripped文件。
3.6 perf timechart
perf timechart是將之前的各種統計信息圖形化的一個工具。
perf timechart record <option> <command>用於記錄整個系統或者一個應用的事件,還可以加option記錄指定類型的事件。
perf timechart用於將perf.data轉換成SVG格式的文件,SVG可以通過Inkscape或者瀏覽器打開。
perf timechart record可以指定特定類型的事件:
-P:記錄power相關事件
-T:記錄任務相關事件
-I:記錄io相關事件
-g:記錄函數調用關係
perf timechart用於將perf timechart record錄取的perf.data轉換成output.svg。
-w調整輸出的svg文件長度,可以查看更多細節。
-p可以指定只查看某些進程輸出,使用方式:sudo perf timechart -p test1 -p thermald
-o 指定輸出文件名
-i 指定待解析的文件名
-w 輸出SVG文件寬度
-P 只顯示power相關事件圖標
-T , --tasks-only 顯示task信息,不顯示處理器信息
-p 顯示指定進程名稱或者PID顯示
--symfs=<directory> 指定系統符號表路徑
-t, --topology 根據拓撲結構對CPU進行分類
--highlight=<duration_nsecs|task_name> 對運行超過特定時間的task高亮
當線程太多影響svg解析速度的時候,可以通過-p指定特定線程進行分析。如果需要幾個線程,每個線程採用-p xxx。
sudo perf timechart record -T ./fork && sudo perf timechart –p fork
結果如下,可以看到相關task的名稱,開始時間/結束時間,每個時間點的狀態(Running/Idle/Deeper Idle/Deepest Idle/Sleeping/Waiting for Cpu /Blocked on IO)。
3.6.1 結合perf timechart和perf report分析函數佔比
由perf report可知test_little、test_medium、test_high、test_hi四個函數佔比分別爲3.84%、12.01%、22.99%、30.43%。
有代碼可知如果以test_little爲1單位,那麼test_medium就爲2單位,test_high爲3單位,test_hi爲4單位。
四個函數執行次數分別爲2、4、4、4,所以四個函數每個單位對應CPU佔比爲:
test_little - 3.84%/2=1.9%
test_medium - 12.01%/4/2=1.5%
test_high - 22.99/4/3=1.9%
test_hi - 30.43%/4/4=1.9%
基本上符合預期。

記錄IO事件,可以看到按應用分類的,Disk/Network/Sync/Poll/Error信息。以及每個應用數據吞吐量。
sudo perf timechart record -I && sudo perf timechart -w 1800。
記錄Power狀態事件,可以看到不同之處在於Idle之類的狀態裏面還有細分C/C2更詳細的顯示Power狀態。
sudo perf timechart record -I && sudo perf timechart -w 1800
3.7 perf script
用於讀取perf record保存的裸trace數據。
使用方法:
perf script [<options>]
perf script [<options>] record <script> [<record-options>] <command>
perf script [<options>] report <script> [script-args]
perf script [<options>] <script> <required-script-args> [<record-options>] <command>
perf script [<options>] <top-script> [script-args]
還可以編寫perl或者python腳本進行數據分析。
3.8 perf lock
3.8.1 perf lock內核配置
要使用此功能,內核需要編譯選項的支持:CONFIG_LOCKDEP、CONFIG_LOCK_STAT。
CONFIG_LOCKDEP defines acquired and release events.
CONFIG_LOCK_STAT defines contended and acquired lock events.
CONFIG_LOCKDEP=y
CONFIG_LOCK_STAT=y
3.8.2 perf lock使用
分析內核鎖統計信息。
鎖是內核用於同步的方法,一旦加了鎖,其他加鎖的內核執行路徑就必須等待,降低了並行。同時,如果加鎖不正確還會造成死鎖。
因此對於內核鎖進行分析是一項重要的調優工作。
perf lock record:抓取執行命令的lock事件信息到perf.data中
perf lock report:產生統計報告
perf lock script:顯示原始lock事件
perf lock info:
-k <value>:sorting key,默認爲acquired,還可以按contended、wait_total、wait_max和wait_min來排序。
Name:內核鎖的名字。
aquired:該鎖被直接獲得的次數,因爲沒有其它內核路徑佔用該鎖,此時不用等待。
contended:該鎖等待後獲得的次數,此時被其它內核路徑佔用,需要等待。
total wait:爲了獲得該鎖,總共的等待時間。
max wait:爲了獲得該鎖,最大的等待時間。
min wait:爲了獲得該鎖,最小的等待時間。
3.9 perf kmem
3.9.1 perf kmem介紹
perf kmem用於跟蹤測量內核slab分配器事件信息。
比如內存分配/釋放等。可以用來研究程序在哪裏分配了大量內存,或者在什麼地方產生碎片之類的和內存管理相關的問題。
perf kmem和perf lock實際上都是perf tracepoint的子類,等同於perf record -e kmem:*和perf record -e lock:*。
但是這些工具在內部隊員是數據進行了慧聰和分析,因此統計報表更具可讀性。
perf kmem record:抓取命令的內核slab分配器事件
perf kmem stat:生成內核slab分配器統計信息
選項:
--caller 顯示每個調用點統計信息
--alloc 顯示每次內存分配事件
-s <key[,key2...]>, --sort=<key[,key2...]>
Sort the output (default: frag,hit,bytes for slab and bytes,hit for page). Available sort keys are ptr, callsite, bytes, hit, pingpong, frag for slab and page, callsite, bytes, hit, order, migtype, gfp for page.
This option should be preceded by one of the mode selection options - i.e. --slab, --page, --alloc and/or --caller.-l <num>, 只顯示固定行數
--raw-ip
Print raw ip instead of symbol
--slab 分析slab分配器事件
--page 分析頁分配事件
--live
Show live page stat. The perf kmem shows total allocation stat by default, but this option shows live (currently allocated) pages instead. (This option works with --page option only)
3.9.2 perf kmem使用
| sudo perf kmem record ls |
sudo perf kmem stat只顯示概要統計信息:
| SUMMARY (SLAB allocator) ======================== Total bytes requested: 368,589 Total bytes allocated: 369,424 Total bytes wasted on internal fragmentation: 835 Internal fragmentation: 0.226028% Cross CPU allocations: 0/2,256 |
sudo perf kmem --alloc --caller --slab stat顯示了更加詳細的分類信息:
|
--------------------------------------------------------------------------------------------------------- --------------------------------------------------------------------------------------------------------- |
該報告有三個部分:根據 Callsite 顯示的部分,所謂 Callsite 即內核代碼中調用 kmalloc 和 kfree 的地方。
比如上圖中的函數proc_reg_open,Hit 欄爲 1,表示該函數在 record 期間一共調用了 kmalloc 一次。
對於第一行 Total_alloc/Per 顯示爲 1024/1024,第一個值 1024 表示函數 proc_reg_open 總共分配的內存大小,Per 表示平均值。
比較有趣的兩個參數是 Ping-pong 和 Frag。Frag 比較容易理解,即內部碎片。雖然相對於 Buddy System,Slab 正是要解決內部碎片問題,但 slab 依然存在內部碎片,比如一個 cache 的大小爲 1024,但需要分配的數據結構大小爲 1022,那麼有 2 個字節成爲碎片。Frag 即碎片的比例。
Ping-pong 是一種現象,在多 CPU 系統中,多個 CPU 共享的內存會出現”乒乓現象”。一個 CPU 分配內存,其他 CPU 可能訪問該內存對象,也可能最終由另外一個 CPU 釋放該內存對象。而在多 CPU 系統中,L1 cache 是 per CPU 的,CPU2 修改了內存,那麼其他的 CPU 的 cache 都必須更新,這對於性能是一個損失。Perf kmem 在 kfree 事件中判斷 CPU 號,如果和 kmalloc 時的不同,則視爲一次 ping-pong,理想的情況下 ping-pong 越小越好。Ibm developerworks 上有一篇講述 oprofile 的文章,其中關於 cache 的調優可以作爲很好的參考資料。
Callsite:內核代碼中調用kmalloc和kfree的地方。
Total_alloc/Per:總共分配的內存大小,平均每次分配的內存大小。
Total_req/Per:總共請求的內存大小,平均每次請求的內存大小。
Hit:調用的次數。
Ping-pong:kmalloc和kfree不被同一個CPU執行時的次數,這會導致cache效率降低。
Frag:碎片所佔的百分比,碎片 = 分配的內存 - 請求的內存,這部分是浪費的。
有使用--alloc選項,還會看到Alloc Ptr,即所分配內存的地址。
後面則有根據被調用地點的顯示方式的部分。
最後一個部分是彙總數據,顯示總的分配的內存和碎片情況,Cross CPU allocation 即 ping-pong 的彙總。
要分析--page事件,需要在record的時候加上--page選項。sudo perf kmem record --page ls,使用sudo perf kmem stat --page查看結果:
| 0xee318 [0x8]: failed to process type: 68 error during process events: -22 |
3.10 perf sched
perf sched專門用於跟蹤/測量調度器,包括延時等。
perf sched record <command>:錄製測試過程中的調度事件
perf sched latency:報告線程調度延時和其他調度相關屬性
perf sched script:查看執行過程中詳細的trace信息
perf sched replay:回放perf sched record錄製的執行過程
perf sched map:用字符表示打印上下文切換
執行sudo perf sched record ls後,通過不同方式查看結果。
sudo perf sched latency,可以看到ls進程的Average delay/Maximum delay時間。各個 column 的含義如下: Task: 進程的名字和 pid Runtime: 實際運行時間 Switches: 進程切換的次數 Average delay: 平均的調度延遲 Maximum delay: 最大延遲
這裏最值得人們關注的是 Maximum delay,一般從這裏可以看到對交互性影響最大的特性:調度延遲,如果調度延遲比較大,那麼用戶就會感受到視頻或者音頻斷斷續續的。
|
----------------------------------------------------------------------------------------------------------------- |
sudo perf sched script能看到更詳細的sched信息,包括sched_wakeup/sched_switch等等。每一列的含義依次是:進程名/pid/CPU ID/時間戳。
| perf 7801 [002] 5398.722314: sched:sched_stat_sleep: comm=perf pid=7806 delay=110095391 [ns] perf 7801 [002] 5398.722316: sched:sched_wakeup: comm=perf pid=7806 prio=120 target_cpu=004 swapper 0 [004] 5398.722328: sched:sched_stat_wait: comm=perf pid=7806 delay=0 [ns] swapper 0 [004] 5398.722333: sched:sched_switch: prev_comm=swapper/4 prev_pid=0 prev_prio=120 prev_state=R ==> next_comm=perf next_pid=7806 next_prio=120 perf 7801 [002] 5398.722363: sched:sched_stat_runtime: comm=perf pid=7801 runtime=1255788 [ns] vruntime=3027478102 [ns] perf 7801 [002] 5398.722364: sched:sched_switch: prev_comm=perf prev_pid=7801 prev_prio=120 prev_state=S ==> next_comm=swapper/2 next_pid=0 next_prio=120 perf 7806 [004] 5398.722568: sched:sched_wakeup: comm=migration/4 pid=27 prio=0 target_cpu=004 perf 7806 [004] 5398.722571: sched:sched_stat_runtime: comm=perf pid=7806 runtime=254732 [ns] vruntime=1979611107 [ns] perf 7806 [004] 5398.722575: sched:sched_switch: prev_comm=perf prev_pid=7806 prev_prio=120 prev_state=R+ ==> next_comm=migration/4 next_pid=27 next_prio=0 migration/4 27 [004] 5398.722582: sched:sched_stat_wait: comm=perf pid=7806 delay=13914 [ns] migration/4 27 [004] 5398.722586: sched:sched_migrate_task: comm=perf pid=7806 prio=120 orig_cpu=4 dest_cpu=2 swapper 0 [002] 5398.722595: sched:sched_stat_wait: comm=perf pid=7806 delay=0 [ns] swapper 0 [002] 5398.722596: sched:sched_switch: prev_comm=swapper/2 prev_pid=0 prev_prio=120 prev_state=R ==> next_comm=perf next_pid=7806 next_prio=120 migration/4 27 [004] 5398.722611: sched:sched_switch: prev_comm=migration/4 prev_pid=27 prev_prio=0 prev_state=S ==> next_comm=swapper/4 next_pid=0 next_prio=120 ls 7806 [002] 5398.723421: sched:sched_stat_sleep: comm=kworker/u12:3 pid=7064 delay=1226675 [ns] ls 7806 [002] 5398.723423: sched:sched_wakeup: comm=kworker/u12:3 pid=7064 prio=120 target_cpu=003 swapper 0 [003] 5398.723432: sched:sched_stat_wait: comm=kworker/u12:3 pid=7064 delay=0 [ns] swapper 0 [003] 5398.723434: sched:sched_switch: prev_comm=swapper/3 prev_pid=0 prev_prio=120 prev_state=R ==> next_comm=kworker/u12:3 next_pid=7064 next_prio=120 kworker/u12:3 7064 [003] 5398.723441: sched:sched_stat_sleep: comm=/usr/bin/termin pid=2511 delay=80833386 [ns] kworker/u12:3 7064 [003] 5398.723447: sched:sched_wakeup: comm=/usr/bin/termin pid=2511 prio=120 target_cpu=004 kworker/u12:3 7064 [003] 5398.723449: sched:sched_stat_runtime: comm=kworker/u12:3 pid=7064 runtime=29315 [ns] vruntime=846439549943 [ns] kworker/u12:3 7064 [003] 5398.723451: sched:sched_switch: prev_comm=kworker/u12:3 prev_pid=7064 prev_prio=120 prev_state=S ==> next_comm=swapper/3 next_pid=0 next_prio=120 swapper 0 [004] 5398.723462: sched:sched_stat_wait: comm=/usr/bin/termin pid=2511 delay=0 [ns] swapper 0 [004] 5398.723466: sched:sched_switch: prev_comm=swapper/4 prev_pid=0 prev_prio=120 prev_state=R ==> next_comm=/usr/bin/termin next_pid=2511 next_prio=120 ls 7806 [002] 5398.723503: sched:sched_migrate_task: comm=perf pid=7801 prio=120 orig_cpu=2 dest_cpu=3 ls 7806 [002] 5398.723505: sched:sched_stat_sleep: comm=perf pid=7801 delay=1142537 [ns] ls 7806 [002] 5398.723506: sched:sched_wakeup: comm=perf pid=7801 prio=120 target_cpu=003 ls 7806 [002] 5398.723508: sched:sched_stat_runtime: comm=ls pid=7806 runtime=920005 [ns] vruntime=3028398107 [ns] swapper 0 [003] 5398.723508: sched:sched_stat_wait: comm=perf pid=7801 delay=0 [ns] swapper 0 [003] 5398.723508: sched:sched_switch: prev_comm=swapper/3 prev_pid=0 prev_prio=120 prev_state=R ==> next_comm=perf next_pid=7801 next_prio=120 ls 7806 [002] 5398.723510: sched:sched_switch: prev_comm=ls prev_pid=7806 prev_prio=120 prev_state=x ==> next_comm=swapper/2 next_pid=0 next_prio=120 /usr/bin/termin 2511 [004] 5398.723605: sched:sched_stat_runtime: comm=/usr/bin/termin pid=2511 runtime=162720 [ns] vruntime=191386139371 [ns] /usr/bin/termin 2511 [004] 5398.723611: sched:sched_switch: prev_comm=/usr/bin/termin prev_pid=2511 prev_prio=120 prev_state=S ==> next_comm=swapper/4 next_pid=0 next_prio=120 |
sudo perf sched map的好處在於提供了一個的總的視圖,將成百上千的調度事件進行總結,顯示了系統任務在 CPU 之間的分佈,假如有不好的調度遷移,比如一個任務沒有被及時遷移到 idle 的 CPU 卻被遷移到其他忙碌的 CPU,類似這種調度器的問題可以從 map 的報告中一眼看出來。
星號表示調度事件發生所在的 CPU。
點號表示該 CPU 正在 IDLE。
| *A0 5398.722333 secs A0 => perf:7806 *. A0 5398.722365 secs . => swapper:0 . *B0 5398.722575 secs B0 => migration/4:27 *A0 B0 5398.722597 secs A0 *. 5398.722611 secs A0 *C0 . 5398.723434 secs C0 => kworker/u12:3:7064 A0 *. . 5398.723451 secs A0 . *D0 5398.723467 secs D0 => /usr/bin/termin:2511 A0 *E0 D0 5398.723509 secs E0 => perf:7801 *. E0 D0 5398.723510 secs . E0 *. 5398.723612 secs |
perf sched replay 這個工具更是專門爲調度器開發人員所設計,它試圖重放 perf.data 文件中所記錄的調度場景。很多情況下,一般用戶假如發現調度器的奇怪行爲,他們也無法準確說明發生該情形的場景,或者一些測試場景不容易再次重現,或者僅僅是出於“偷懶”的目的,使用 perf replay,perf 將模擬 perf.data 中的場景,無需開發人員花費很多的時間去重現過去,這尤其利於調試過程,因爲需要一而再,再而三地重複新的修改是否能改善原始的調度場景所發現的問題。
| run measurement overhead: 166 nsecs sleep measurement overhead: 52177 nsecs the run test took 999975 nsecs the sleep test took 1064623 nsecs nr_run_events: 11 nr_sleep_events: 581 nr_wakeup_events: 5 task 0 ( swapper: 0), nr_events: 11 task 1 ( swapper: 1), nr_events: 1 task 2 ( swapper: 2), nr_events: 1 task 3 ( kthreadd: 3), nr_events: 1 ... task 563 ( kthreadd: 7509), nr_events: 1 task 564 ( bash: 7751), nr_events: 1 task 565 ( man: 7762), nr_events: 1 task 566 ( kthreadd: 7789), nr_events: 1 task 567 ( bash: 7800), nr_events: 1 task 568 ( sudo: 7801), nr_events: 4 task 569 ( perf: 7806), nr_events: 8 ------------------------------------------------------------ #1 : 25.887, ravg: 25.89, cpu: 1919.68 / 1919.68 #2 : 27.994, ravg: 26.10, cpu: 2887.76 / 2016.49 #3 : 26.403, ravg: 26.13, cpu: 2976.09 / 2112.45 #4 : 29.400, ravg: 26.46, cpu: 1015.01 / 2002.70 #5 : 26.750, ravg: 26.49, cpu: 2942.80 / 2096.71 #6 : 27.647, ravg: 26.60, cpu: 3087.37 / 2195.78 #7 : 31.405, ravg: 27.08, cpu: 2762.43 / 2252.44 #8 : 23.770, ravg: 26.75, cpu: 2172.55 / 2244.45 #9 : 26.952, ravg: 26.77, cpu: 2794.93 / 2299.50 #10 : 30.904, ravg: 27.18, cpu: 973.26 / 2166.88 |
3.11 perf probe
Need to find vmlinux XXXXXXXXXXXXXXXXXX
可以自定義探測點。
Define new dynamic tracepoints.
使用例子
(1) Display which lines in schedule() can be probed
# perf probe --line schedule
前面有行號的可以探測,沒有行號的就不行了。
(2) Add a probe on schedule() function 12th line.
# perf probe -a schedule:12
在schedule函數的12處增加一個探測點。
3.14 perf trace
perf trace類似於strace,但增加了其他系統事件的分析,比如pagefaults、task lifetime事件、scheduling事件等。
下面的命令可以查看系統中已經安裝的腳本:
 # perf trace -l
    List of available trace scripts:
      syscall-counts [comm]                system-wide syscall counts
      syscall-counts-by-pid [comm]         system-wide syscall counts, by pid
      failed-syscalls-by-pid [comm]        system-wide failed syscalls, by pid
比如 failed-syscalls 腳本,執行的效果如下:
 # perf trace record failed-syscalls
    ^C[ perf record: Woken up 11 times to write data ]
    [ perf record: Captured and wrote 1.939 MB perf.data (~84709 samples) ]

 perf trace report failed-syscalls
    perf trace started with Perl script \
	 /root/libexec/perf-core/scripts/perl/failed-syscalls.pl

    failed syscalls, by comm:

    comm                    # errors
    --------------------  ----------
    firefox                     1721
    claws-mail                   149
    konsole                       99
    X                             77
    emacs                         56
    [...]

    failed syscalls, by syscall:

    syscall                           # errors
    ------------------------------  ----------
    sys_read                              2042
    sys_futex                              130
    sys_mmap_pgoff                          71
    sys_access                              33
    sys_stat64                               5
    sys_inotify_add_watch                    4
    [...]
該報表分別按進程和按系統調用顯示失敗的次數。非常簡單明瞭,而如果通過普通的 perf record 加 perf report 命令,則需要自己手工或者編寫腳本來統計這些數字。
4. perf擴展應用
4.1 Flame Graph
1.抓取perf信息並轉換
perf record -F 99 -a -g -- sleep 60
perf script > out.perf
./stackcollapse-perf.pl out.perf > out.folded
./flamegraph.pl out.kern_folded > kernel.svg
5. 參考資料
系統級性能分析工具 — Perf:http://blog.csdn.net/zhangskd/article/details/37902159/
linux perf - 性能測試和優化工具:http://www.cnblogs.com/hushaojun/p/4848269.html
Linux下的內核測試工具——perf使用簡介:http://www.blogjava.net/qileilove/archive/2013/09/04/403646.html
Perf -- Linux下的系統性能調優工具,第 1 部分:http://www.ibm.com/developerworks/cn/linux/l-cn-perf1/
Perf -- Linux下的系統性能調優工具,第 2 部分:https://www.ibm.com/developerworks/cn/linux/l-cn-perf2/
性能分析工具---Perf簡介彙總整理:http://sanwen.net/a/nzsrvoo.html
聯繫方式:[email protected]