prometheus 介紹
Prometheus是一個開源的系統監控和報警工具包,普羅米修斯在2016年加入了雲原生計算基金會,成爲繼Kubernetes之後的第二個項目。普羅米修斯的主要特徵是:
多維數據模型,時間序列數據由度量名稱和鍵/值對標識
PromQL是一種靈活的查詢語言,可以利用這種維度
不依賴分佈式存儲;單個服務器節點是自治的
時間序列收集通過HTTP上的拉模型進行
通過中間網關支持時間序列的推送
通過服務發現或靜態配置發現目標
多種模式的繪圖和儀表板的支持
架構圖
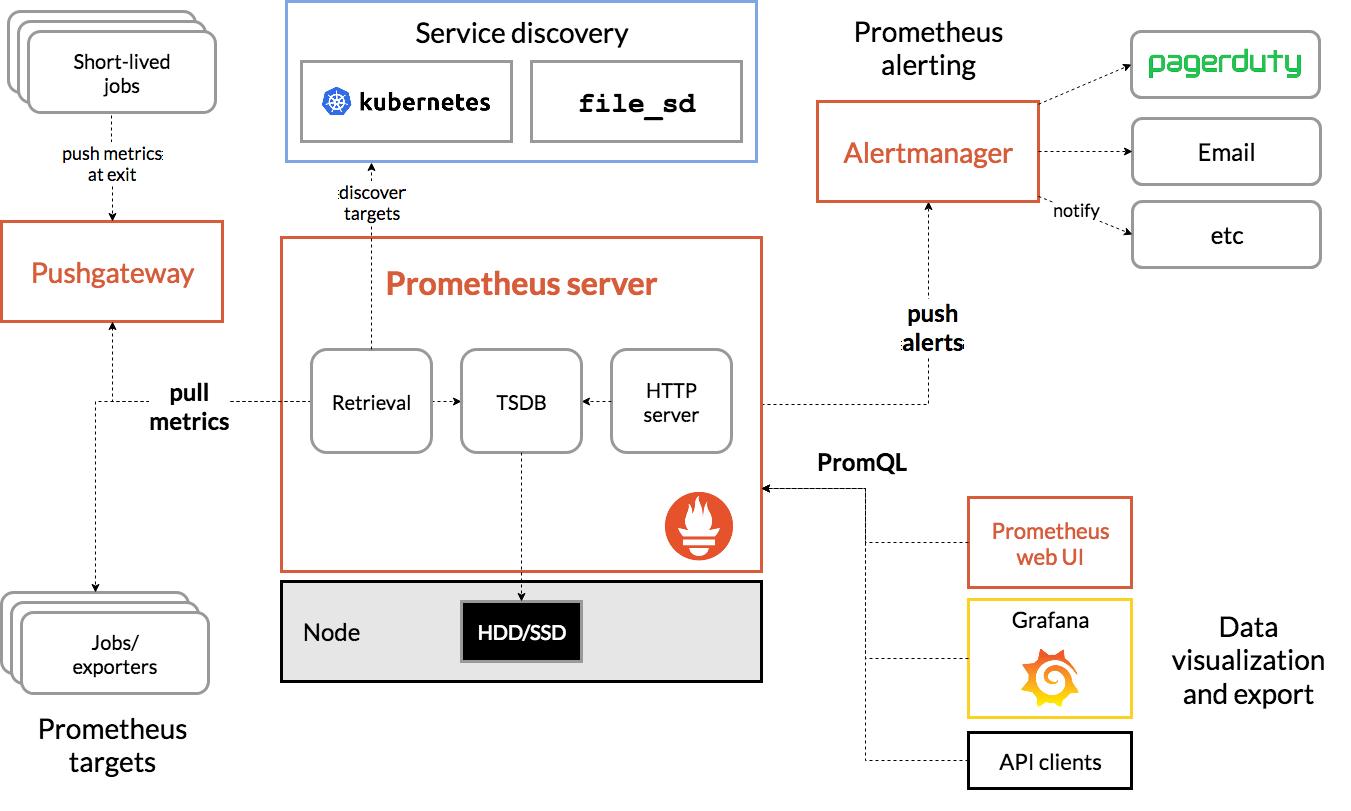
組件
prometheus server 端 負責定時在目標上抓取metrics(指標)數據,每個抓取目標都需要暴露一個http 服務接口用於 prometheus 定時抓取,這種調用監控對象獲取監控數據的方式稱爲pull
prometheus client 端 爲需要監控的服務生成相應的 metrics 並暴露給 Prometheus server
Push Gateway:主要用於短期的 jobs。由於這類 jobs 存在時間較短,可能在
Prometheus 來 pull 之前就消失了。爲此,這次 jobs 可以直接向 Prometheus server 端推送它們的 metrics。這種方式主要用於服務層面的 metrics,對於機器層面的 metrices,需要使用 node exporter。
Exporters:支持如 HAProxy,StatsD,Graphite,Redis 一類的服務;
Alertmanager:從 Prometheus server 端接收到 alerts 後,會進行去除重複數據,分組,並路由到對收的接受方式,發出報警。常見的接收方式有:電子郵件,pagerduty,OpsGenie, webhook 等。
prometheus 核心概念
1、指標
prometheus 所有的監控指標(Metric) 被統一定義爲
<metric name >{<label name>=<label value>, ...}
指標名稱說明指標的含義,例如 tcp_request_total 代表 tcp 的請求總數
指標名稱必須由 字母、數值下畫線或者冒號組成,符合正則表達式
如 [a-zA-Z:][a-zA-Z0-9:]*。
標籤(label) 用於過濾和聚合
2、數據採集
prometheus 採用pull 方式採集監控數據,和採用push 方式採集監控數據不同,
push 方式,agent 主動上報數據,可以將採集的數據立即上報到監控中心,push 方式本地不會保存採集的數據,agent 本身是無狀態的服務,master 需要維護各種agent 狀態
pull 方式 master 主動拉取 agent 的數據,週期性採集,採集時間爲30s 或者更長時間,
agent 本身需要一定的數據存儲能力,master 只負責簡單的數據拉取
3、數據處理
prometheus 支持數據處理,主要包括 relabel 、replace、keep、drop
4、數據存儲
prometheus 支持本地存儲和遠程存儲兩種方式
5、數據查詢
prometheus 使用promQL 查詢
6、告警
prometheus 本身不會對報警進行處理、需要藉助一個組件alertmanager ,prometheus 會配置alertmanager 地址,這樣prometheus 發出的告警記錄變可以發送到alertmanager 進行處理
部署方式
二進制部署

下載tar zxf prometheus-2.14.0.linux-amd64.tar.gz && cd prometheus
修改配置文件
scrape_configs:
The job name is added as a label job=<job_name> to any timeseries scraped from this config.
-
job_name: 'prometheus'
metrics_path defaults to '/metrics'
scheme defaults to 'http'.static_configs:
-
targets: ['localhost:9090'] # 默認localhost
啓動 prometheus
nohup /opt/prometheus/prometheus --config.file=prometheus.yml &
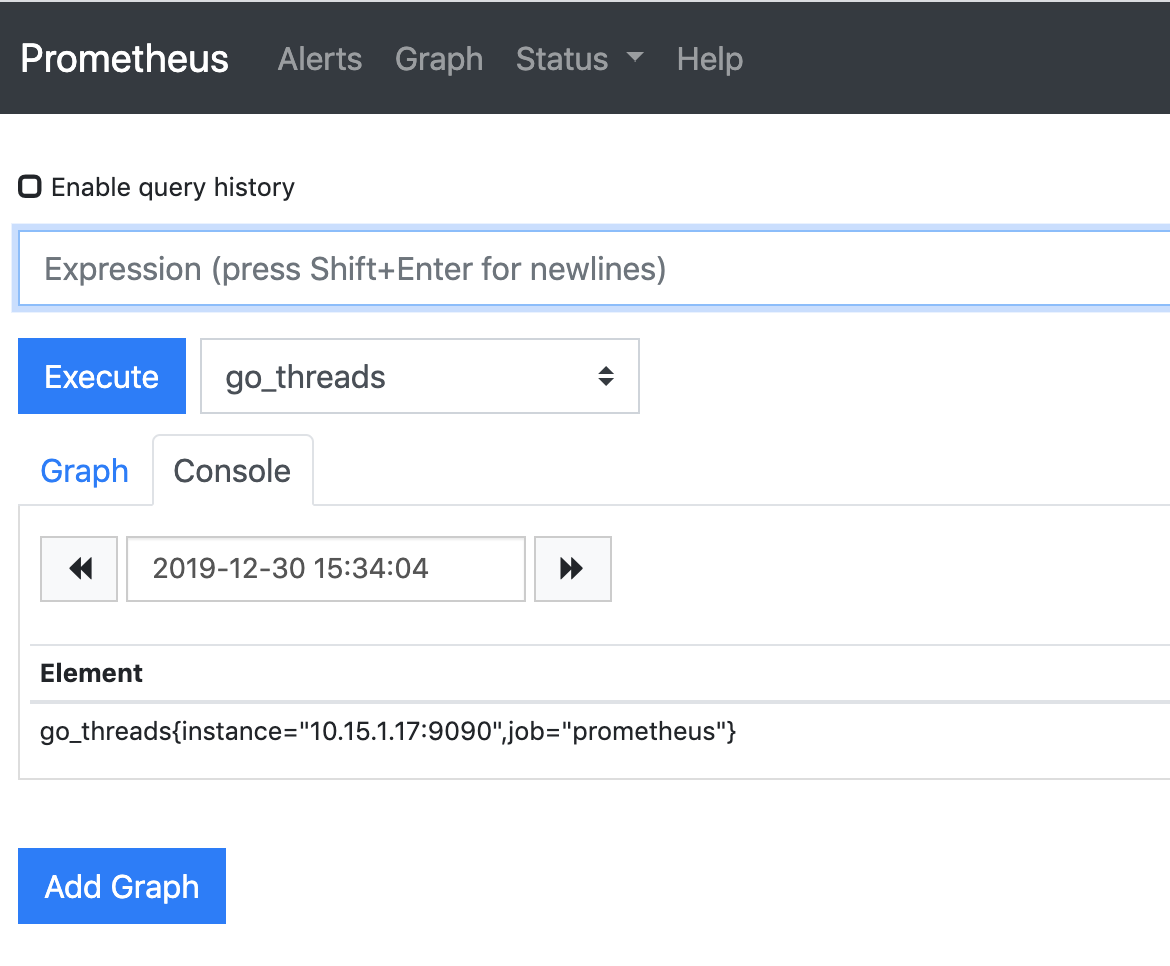
訪問
-