操作步驟:
sudo docker run \
    --restart=always \
  --volume=/:/rootfs:ro \
  --volume=/var/run:/var/run:ro \
  --volume=/sys:/sys:ro \
  --volume=/var/lib/docker/:/var/lib/docker:ro \
  --volume=/dev/disk/:/dev/disk:ro \
  --publish=8080:8080 \
  --detach=true \
  --name=cadvisor \
  google/cadvisor:v0.33.0

echo '
global:
  scrape_interval: 15s
  scrape_timeout: 10s
  evaluation_interval: 15s
alerting:
  alertmanagers:
  - static_configs:
    - targets: []
    scheme: http
    timeout: 10s
scrape_configs:
- job_name: prometheus
  scrape_interval: 15s
  scrape_timeout: 10s
  metrics_path: /metrics
  scheme: http
  static_configs:
  - targets: [localhost:9090,tx.20has.win:8080]
#    - localhost:9090
#    - tx.20has.win:8080
'>/data/docker/prometheus/prometheus.yml

docker run -d \
--name prometheus \
--restart=always \
-p9090:9090 \
-v /data/docker/prometheus/prometheus.yml:/etc/prometheus/prometheus.yml \
-v /prometheus \
prom/prometheus

docker run -d --restart=always --name=grafana -p 3000:3000 grafana/grafana
小結:
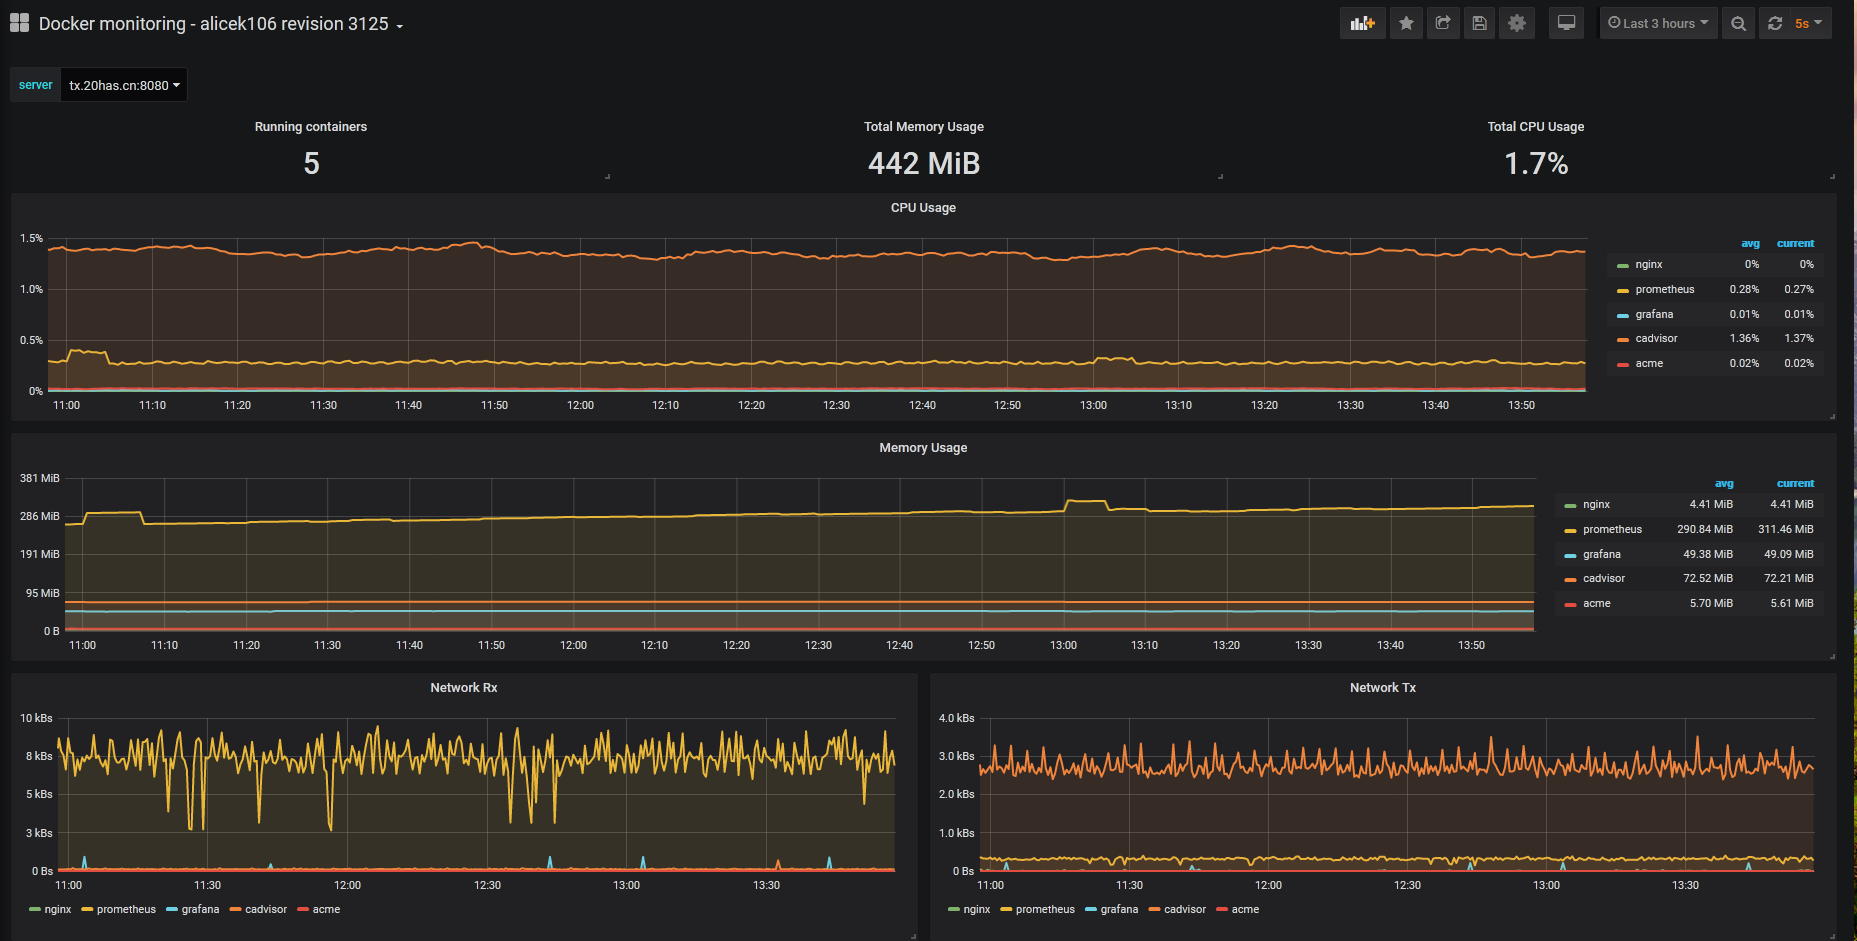
推薦個garafan比較好用的監控容器的模版 模版號:3125
架構: cadvisor收集容器信息---->prometheus(支持cadvisor插件作爲收集端)--->grafana出圖展示
prometheus不是實時監控方案,默認的是每15s展示一次數據。
展示效果如下: