


前言、 Elastic Stack
Elastic Stack是ELK的官方稱呼,網址:https://www.elastic.co/cn/products ,其作用是“構建在開源基礎之上, Elastic Stack 讓您能夠安全可靠地獲取任何來源、任何格式的數據,並且能夠實時地對數據進行搜索、分析和可視化。”
它主要包括三個元件:
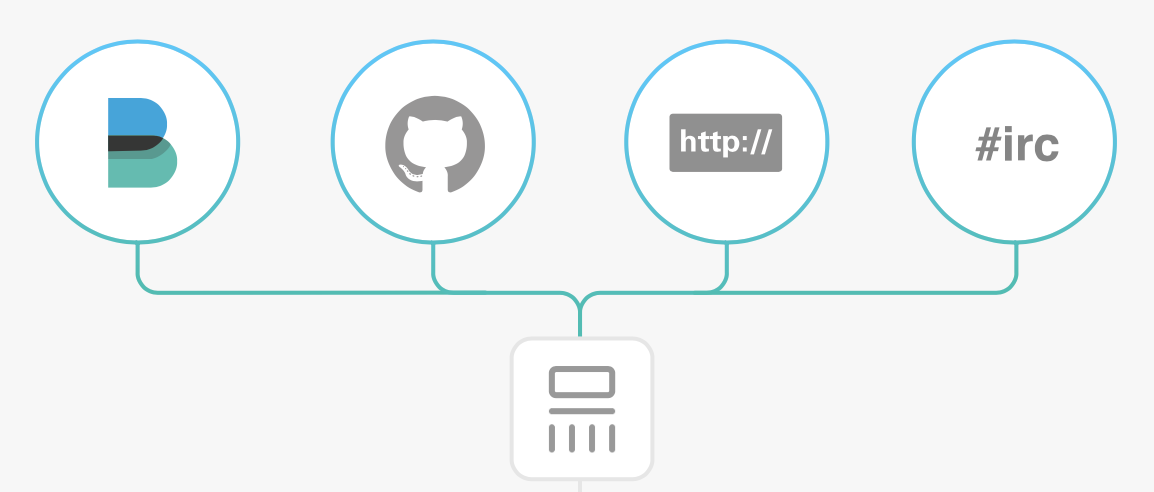
- Beats + Logstash:採集任何格式,任何來源的數據。
Beats: Beats 是輕量型採集器的平臺,從邊緣機器向 Logstash 和 Elasticsearch 發送數據。
Beats 是數據採集的得力工具。將這些採集器安裝在您的服務器中,它們就會把數據彙總到 Elasticsearch。如果需要更加強大的處理性能,Beats 還能將數據輸送到 Logstash進行轉換和解析。官方提供了多種現成的beats以針對不同協議的數據:
Filebeat:日誌文件
Metricbeat:指標
Packagebeat: 網絡數據
Winlogbeat: windows時間日誌
Auditbeat: 審計日誌
Heartbeat: 心跳日誌
beat實現可定製化:每款開源採集器都是以用於轉發數據的通用庫 libbeat 爲基石。需要監控某個專用協議?您可以自己構建採集器。我們將爲您提供所需的構建基塊。
Logstash: Logstash 是動態數據收集管道,擁有可擴展的插件生態系統,能夠與 Elasticsearch 產生強大的協同作用。
Logstash 是開源的服務器端數據處理管道,能夠同時 從多個來源採集數據、轉換數據,然後將數據發送到您最喜歡的 “存儲庫” 中。(我們的存儲庫當然是Elasticsearch。)
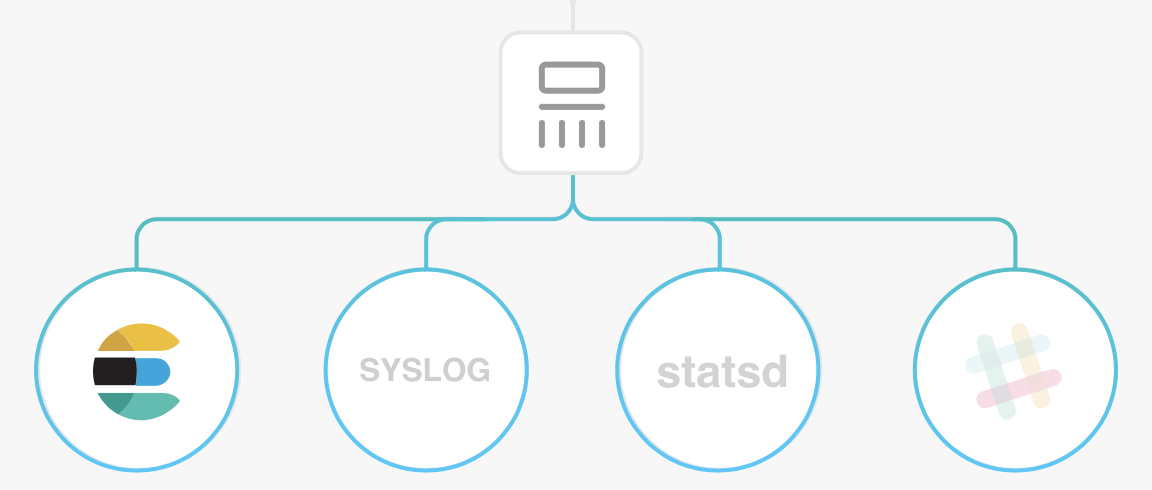
多種輸入選擇:數據往往以各種各樣的形式,或分散或集中地存在於很多系統中。Logstash 支持各種輸入選擇 ,可以在同一時間從衆多常用來源捕捉事件。能夠以連續的流式傳輸方式,輕鬆地從您的日誌、指標、Web 應用、數據存儲以及各種 AWS 服務採集數據。
輸出:儘管 Elasticsearch 是我們的首選輸出方向,能夠爲我們的搜索和分析帶來無限可能,但它並非唯一選擇。Logstash 提供衆多輸出選擇,您可以將數據發送到您要指定的地方,並且能夠靈活地解鎖衆多下游用例。
過濾器:數據從源傳輸到存儲庫的過程中,Logstash 過濾器能夠解析各個事件,識別已命名的字段以構建結構,並將它們轉換成通用格式,以便更輕鬆、更快速地分析和實現商業價值。
可擴展:Logstash 採用可插拔框架,擁有 200 多個插件。您可以將不同的輸入選擇、過濾器和輸出選擇混合搭配、精心安排,讓它們在管道中和諧地運行。您是從自定義應用程序採集數據?沒有看到所需的插件?Logstash 插件很容易構建。我們有一個極好的插件開發 API 和插件生成器,可幫助您開始和分享您的創作。
- Elasticsearch
Elasticsearch 是一個分佈式的 RESTful 風格的搜索和數據分析引擎,能夠解決不斷湧現出的各種用例。作爲 Elastic Stack 的核心,它集中存儲您的數據,幫助您發現意料之中以及意料之外的情況。
可擴展性:原型環境和生產環境可無縫切換;無論 Elasticsearch 是在一個節點上運行,還是在一個包含 300 節點的集羣上運行,您都能夠以相同的方式與 Elasticsearch 進行通信。
速度:而且由於每個數據都被編入了索引,因此您再也不用因爲某些數據沒有索引而煩心。您可以用快到令人髮指的速度使用和訪問您的所有數據。
- Kibana
Kibana 能夠以圖表的形式呈現數據,並且具有可擴展的用戶界面,供您全方位配置和管理 Elastic Stack。
可視化與探索:Kibana 讓您能夠自由地選擇如何呈現您的數據。或許您一開始並不知道自己想要什麼。不過藉助 Kibana 的交互式可視化,您可以先從一個問題出發,看看能夠從中發現些什麼。
多配件:Kibana 核心搭載了一批經典功能:柱狀圖、線狀圖、餅圖、環形圖,等等。它們充分利用了 Elasticsearch 的聚合功能。
部署準備
操作系統版本:CentOS6.9 64位(CentOS7及其他Linux系統都沒有問題)
Elasticsearch版本:6.2.2 下載地址:https://artifacts.elastic.co/downloads/elasticsearch/elasticsearch-6.2.2.tar.gz
Kibana版本:6.2.2 下載地址:https://artifacts.elastic.co/downloads/beats/filebeat/filebeat-6.2.2-linux-x86_64.tar.gz
filebeat版本:6.2.2 下載地址:https://artifacts.elastic.co/downloads/beats/filebeat/filebeat-6.2.2-linux-x86_64.tar
logstash版本:6.2.2 下載地址:https://artifacts.elastic.co/downloads/logstash/logstash-6.2.2.tar.gz
這裏默認你已經安裝配置好了JDK1.8,如果沒有的話請自行安裝配置
注意,如無特殊說明以下操作都是在root用戶下操作的(一開始的時候搞大數據,都是用普通用戶+sudo權限操作的,然後發現好多權限問題,後來乾脆全部root用戶)
一、安裝 elasticsearch
第一步:下載Elasticsearch6.2.2
[root@netcloud01 ~]# cd /data
[root@netcloud01 data]# wget https://artifacts.elastic.co/downloads/elasticsearch/elasticsearch-6.2.2.tar.gz
第二步:解壓Elasticsearch
[root@netcloud01 data]# tar -zxvf elasticsearch-6.2.2.tar.gz
第三步:創建Elasticsearch用戶和所在組
Elasticsearch默認是不允許root用戶運行的,不管是Elasticsearch5還是Elasticsearch6,否則的話Elasticsearch運行的時候會報錯
1. 先創建es組,並指定組id爲 503(我是搞大數據的,大數據所有用戶及應用全部放在bigdata用戶組內)

[root@netcloud01 data]# groupadd -g 503 bigdata

2. 創建es用戶並指定所在組爲 es

[root@netcloud01 data]# useradd -g es es
查看是否創建成功
[root@netcloud01 data]# id es
uid=500(es) gid=503(es) groups=503(es)
第四步:更改解壓的Elasticsearch應用所屬用戶及組
[root@netcloud01 data]# chown -R es:es elasticsearch-6.2.2
來現在咱看下Elasticsearch的bin目錄:
我們發現有很多.bat文件,這個是Windows下執行的腳本
看着就不爽,果斷刪除
第五步:執行腳本添加可執行權限
[root@netcloud01 bin]# chmod u+x *
第六步:修改配置文件
1、修改limits.conf配置文件(修改用戶最大可創建文件數)
vim /etc/security/limits.conf

# End of file
# 添加如下內容

* soft nofile 1026420
* hard nofile 1026420
* soft nproc unlimited
* hard nproc unlimited
2、修改90-nproc.conf
vim /etc/security/limits.d/90-nproc.conf
# 修改成4096或者更大
*          soft    nproc     4096
root       soft    nproc     unlimited
3. 修改sysctl.conf
vim /etc/sysctl.conf

# 尾部添加下面的配置
vm.max_map_count=655360

# 然後執行命令
sysctl -p
4. 修改elasticsearch.yml
# 集羣名稱
cluster.name: BSDSJ

# 當前節點名稱,這裏配置爲主機名
node.name: node-1

# Centos6不支持SecComp,
bootstrap.memory_lock: false
bootstrap.system_call_filter: false

# 默認的只能本機訪問,修改後就可以遠程訪問了
network.host: 172.16.240.16

http.port: 9200
transport.tcp.port: 9500
會導致失敗
上面的配置都要一個一個配置啊,不然後面你還要根據報錯一個一個改
第七步:啓動
從root用戶切換到es用戶,
然後在Elasticsearch根目錄下執行
bin/elasticsearch

看到這個頁面說明已經安裝啓動成功了,
不過還是要測試一下
Linux下輸入curl命令測試一下
也可以編寫一個啓動程序文件在後臺啓動:
[root@netcloud01 bin]# vi startup.sh
#!/bin/
ES_HOME=/data/elasticsearch-6.2.2
nohup $ES_HOME/bin/elasticsearch  -v  >> $ES_HOME/logs/elasticsearch.log 2>&1 &
[root@netcloud01 bin]# chmod u+x startup.sh
[root@netcloud01 bin]# sh startup.sh
測試:
[root@netcloud01 elasticsearch-6.2.2]# curl 172.16.240.103:9200
{
  "name" : "node-1",
  "cluster_name" : "BSDSJ",
  "cluster_uuid" : "DX0_WhyITd23l2dc_nmlUw",
  "version" : {
    "number" : "6.2.2",
    "build_hash" : "10b1edd",
    "build_date" : "2018-02-16T19:01:30.685723Z",
    "build_snapshot" : false,
    "lucene_version" : "7.2.1",
    "minimum_wire_compatibility_version" : "5.6.0",
    "minimum_index_compatibility_version" : "5.0.0"
  },
  "tagline" : "You Know, for Search"
}
curl是CentOS自帶的,如果你的系統上沒有的話請自行安裝
這裏是通過主機名加端口號訪問的,
我這裏主機名已經映射了IP地址,所以也可以通過IP地址加端口號訪問
下面通過瀏覽器訪問試試
在瀏覽器輸入地址:http://172.16.240.103:9200/

二:安裝Kibana
1.獲取kibana安裝包,解壓,進入目錄
[root@netcloud01 data]# wget https://artifacts.elastic.co/downloads/kibana/kibana-6.2.2-linux-x86_64.tar.gz
[root@netcloud01 data]# tar -xzf kibana-6.2.2-linux-x86_64.tar.gz
[root@netcloud01 data]# cd kibana-6.2.2-linux-x86_64/
2.修改kibana.yml配置文件
添加如下配置項:
server.port: 5601      #端口
server.host: 172.16.240.103    #服務ip
server.name: "knode01"  #服務名稱
elasticsearch.url: "http://172.16.240.103:9200"  #es集羣url
elasticsearch.username: "kibana"     #kibana用戶名
elasticsearch.password: "kibana"    #kibana密碼
3.啓動驗證
./bin/kibana

注意:未安裝x-pack插件的kibana只具有基本功能,Monitoring、Graph等功能不能使用。
4.安裝x-pack
在線安裝:
[root@netcloud01 kibana-6.2.2-linux-x86_64]#  ./bin/kibana-plugin install x-pack
離線安裝:
[root@netcloud01 kibana-6.2.2-linux-x86_64]#  wget https://artifacts.elastic.co/downloads/packs/x-pack/x-pack-6.2.2.zip
[root@netcloud01 kibana-6.2.2-linux-x86_64]#  ./bin/kibana-plugin install file:///data/x-pack-6.2.2.zip

#注意路徑
5.重新啓動驗證(出現下面的報錯信息)
[root@netcloud01 ~]# ./bin/kibana

解決方法:
elasticsearch 6.3版本之前的添加認證需安裝x-pack插件,6.3之後貌似去掉了這個。
1)去elasticsearch 目錄安裝 安裝X-Pack
[root@netcloud01 bin]# elasticsearch-plugin install file:///data/x-pack-6.2.2.zip
2)設置密碼:
會對elasticsearch、logstash、kibana分別設置登錄密碼(默認es用戶名爲elastic,logstash用戶名爲logstash_system,kibana用戶名爲kibana)
[es@netcloud01 bin]$  cd /data/elasticsearch-6.2.2/bin/x-pack
[es@netcloud01 x-pack]$ ./setup-passwords interactive

6、重新啓動 kibana服務 正常運行
[root@netcloud01 ~]# ./bin/kibana >> /data/kibana-6.2.2-linux-x86_64/logs/kibana.log 2>&1 &
8、驗證:http://172.16.240.103:5601
輸入用戶密碼登錄即可: username: kibana passwd: kibana

三、安裝filebeat
1、爲什麼要使用filebeat?
談到ELK,說起日誌傳輸,首先想到的就是Logstash,Logstash主要的優點就是它的靈活性,這還主要因爲它有很多插件。豐富的輸入插件可以採集各種樣式、大小和來源的數據。豐富的過濾插件可以實時解析和轉換數據,能夠動態地轉換和解析數據,不受格式或複雜度的影響,Logstash 提供衆多輸出選擇,您可以將數據發送到您要指定的地方,並且能夠靈活地解鎖衆多下游用。
Logstash致命的問題是它的性能以及資源消耗(默認的堆大小是 1GB)。儘管它的性能在近幾年已經有很大提升,與它的替代者們相比還是要慢很多的。如果服務器性能較差,並不推薦爲每個服務器安裝 Logstash ,這樣就需要一個輕量的日誌傳輸工具,將數據從服務器端經由一個或多個 Logstash 中心服務器傳輸到 Elasticsearch。
FileBeat介紹
Filebeat是一個輕量級的日誌傳輸工具,它的存在正彌補了,Logstash的缺點:Filebeat作爲一個輕量級的日誌傳輸工具可以將日誌推送到Logstash 或者緩衝池中。
2、安裝filebeat
[root@netcloud01 ~]# cd /data

[root@netcloud01 ~]# wget https://artifacts.elastic.co/downloads/beats/filebeat/filebeat-6.2.2-linux-x86_64.tar

[root@netcloud01 ~]# tar -zxvf filebeat-6.2.2-linux-x86_64.tar
[root@netcloud01 ~]# ll
-rwxr-xr-x 1 root root 11354200 Sep 15  2016 filebeat
-rw-r--r-- 1 root root      814 Sep 15  2016 filebeat.template.json
-rw-r--r-- 1 root root    17335 Aug 13  2018 filebeat.yml
drwxr-xr-x 2 root root     4096 Dec 18 21:43 logs
-rw-r--r-- 1 root root      153 Sep  1  2017 startup.sh
Filebeat的配置很簡單,只需要配置監控的日誌文件的全路徑和輸出端的IP,一般默認(默認配置文件filebeat.yml)是輸出到ElasticSearch,也可以輸出到kafka,在這裏我們輸出到logstash
3、配置
input:
#=========================== Filebeat prospectors =============================

filebeat.prospectors:

# Each - is a prospector. Most options can be set at the prospector level, so
# you can use different prospectors for various configurations.
# Below are the prospector specific configurations.

- type: log

  # Change to true to enable this prospector configuration.
  #設置爲true使該配置生效
  enabled: true

  #收集日誌路徑,多個往下繼續寫就可以了
  # Paths that should be crawled and fetched. Glob based paths.
  paths:
    #- /var/log/*.log
    - /data/bigdata_web.log

  # Exclude lines. A list of regular expressions to match. It drops the lines that are
  # matching any regular expression from the list.
  #exclude_lines: ['^DBG']

  # Include lines. A list of regular expressions to match. It exports the lines that are
  # matching any regular expression from the list.
  #include_lines: ['^ERR', '^WARN']

  # Exclude files. A list of regular expressions to match. Filebeat drops the files that
  # are matching any regular expression from the list. By default, no files are dropped.
  #exclude_files: ['.gz$']

  # Optional additional fields. These fields can be freely picked
  # to add additional information to the crawled log files for filtering
  #fields:
  #  level: debug
  #  review: 1

  ### Multiline options
output: 註釋掉elasticsearch 默認輸出
#-------------------------- Elasticsearch output ------------------------------
#output.elasticsearch:
  # Array of hosts to connect to.
  #hosts: ["localhost:9200"]

  # Optional protocol and basic auth credentials.
  #protocol: "https"
  #username: "elastic"
  #password: "changeme"

#----------------------------- Logstash output --------------------------------
output.logstash:
  # The Logstash hosts
  hosts: ["172.16.240.103:5044"]

  # Optional SSL. By default is off.
  # List of root certificates for HTTPS server verifications
  #ssl.certificate_authorities: ["/etc/pki/root/ca.pem"]

  # Certificate for SSL client authentication
  #ssl.certificate: "/etc/pki/client/cert.pem"

  # Client Certificate Key
  #ssl.key: "/etc/pki/client/cert.key"
4、啓動:
編寫啓動文件:startup.sh
vi startup.sh
#!/bin/
FILEBEAT_HOME=/data/filebeat-6.2.2-linux-x86_64
nohup $FILEBEAT_HOME/filebeat -c $FILEBEAT_HOME/filebeat.yml > $FILEBEAT_HOME/logs/filebeat.log 2>&1 &
chmod u+x startup.sh

sh startup.sh
如果是集成kafka配置如下:
這裏我們不直接輸出到ElasticSearch,而是kafka,所以需要配置 beat-kafka.yml,輸入端配置如下

輸出端配置

因爲是輸出到kafka,所以需要制定kafka的topic
Kafka的安裝
在Filebeat已經配置輸出端爲kafka的配置,這裏kafaka不需要配置任何東西,解壓直接用,以下是kafka初用的幾個必須的命令,具體查看kafka的官方API
bin/kafka-console-producer.sh --broker-list localhost:9092 --topic test
bin/kafka-console-consumer.sh --bootstrap-server localhost:9092 --topic test --from-beginning
現在啓動Filebeat:
./filebeat -e -c beat-kafka.yml -d "publish"
這裏需要說明一點,不同的輸出端可以配置不同的.yml文件,所以這裏的 beat-kafka.yml文件是kafka對應的配置
以上命令輸出沒有報錯並有如下信息

且可以看到你的監控文件的log的信息字段證明不存在問題
這是kafka的consumer會有如下信息

message就是文件的具體信息
四、安裝logstash
1、安裝
[root@netcloud01 ~]# cd /data
[root@netcloud01 ~]# https://artifacts.elastic.co/downloads/logstash/logstash-6.2.2.tar.gz
2、配置
[root@netcloud01 logstash-6.2.2]# vi bigdata-web-log-pipeline.conf
input {
    beats {
        port => "5044"
    }
}
filter {
    grok {
        remove_field => [ "@version", "@timestamp", "beat", "offset", "type", "source", "input_type", "count", "fields", "host", "tags" ]
        patterns_dir => ["./patterns"]
        match => {
            "message" => "(?<request_time>.*) INFO \[IP\[%{IP:client_ip}\], Account\[username:(?<username>.*), code:(?<code>.*), name:(?<name>.*)\], URL\[(?<request_url>.*)\], Request\[method:(?<request_method>.*), headers:(?<request_header>.*), params:(?<request_param>.*)\], Response\[headers:(?<response_header>.*), code:(?<response_code>.*)\], Cost\[(?<cost_millis>.*)ms\]\].*"
        }
    }
}
output {
    elasticsearch {
        hosts => [ "172.16.140.103:9200" ]
        index => "bigdata_web_log"
    }
}
3、編寫啓動程序
[root@netcloud01 bin]# vi startup.sh
#!/bin/
LOGSTASH_HOME=/data/logstash-6.2.2
nohup $LOGSTASH_HOME/bin/logstash -f $LOGSTASH_HOME/bigdata-web-log-pipeline.conf -v >> $LOGSTASH_HOME/logs/logstash.log 2>&1 &
授權執行權限:
chmod u+x startup.sh
4、啓動
[root@netcloud01 bin]# sh startup.sh
下面的配置是將日誌文件輸出到kafka 然後到logstash 再到ElasticSearch
Logstash也不要做太多的配置,從搭建Filebeat和Kafka時,已經實現了數據的流通,現在要完成的事是然流到kafka的數據流到logstash,logtash也需要輸出,將ElasticSearch作爲輸出端
對於kafka不同的數據建議logstash用不同的通道去接
一下是配置的兩個不同的通道


啓動logstash
bin/logstash -f first-pipeline.conf --config.reload.automatic --path.data=/home/hadoop/logstash
--path.data=/home/hadoop/logstash是指存放數據的路徑