


一、DB Time和Elapsed time
     Snap Id      Snap Time      Sessions Curs/Sess
--------- ------------------- -------- ---------
Begin Snap:     21787 21-Feb-13 20:00:22        50      19.5
End Snap:     21798 22-Feb-13 07:00:47        44      20.0
Elapsed:              660.42 (mins)
DB Time:              928.06 (mins)
--Elapsed < DB Time
--Elapsed Time=(20130222 07:00:00 - 20130221 20:00:00)≈ 660
--DB Time=928.06 ,運行環境爲16核CPU, 660*16=10560, cpu花費了928.06分鐘在處理Oralce非空閒等待和運算上
--從上可知,整個系統還是比較空閒二.Host Cpu(整個主機的CPU負載情況)
650) this.width=650;" src="http://img1.51cto.com/attachment/201308/124700960.png" title="1122.png" />
“Load Average” begin/end值代表CPU的大致運行隊列大小。
上圖中快照開始到結束,平均 CPU負載增加了。
%User+%System=> 總的CPU使用率,在這裏是29.0%。空閒的CPU使用率爲71%。
三.Instance CPU(數據庫實例消耗的CPU)
1.%Total CPU,該實例所使用的CPU佔總CPU的比例—>% of total CPU for Instance
2.%Busy CPU,該實例所使用的Cpu佔總的被使用CPU的比例—> % of busy CPU for Instance
3.例如共4個邏輯CPU,其中3個被完全使用,3箇中的1個完全被該實例使用,則%Total CPU= ¼ =25%,而%Busy CPU= 1/3= 33%
4.當CPU高時一般看%Busy CPU可以確定CPU到底是否是本實例消耗的,還是主機上其他程序.
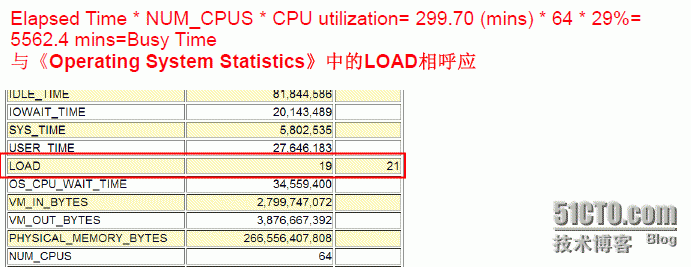
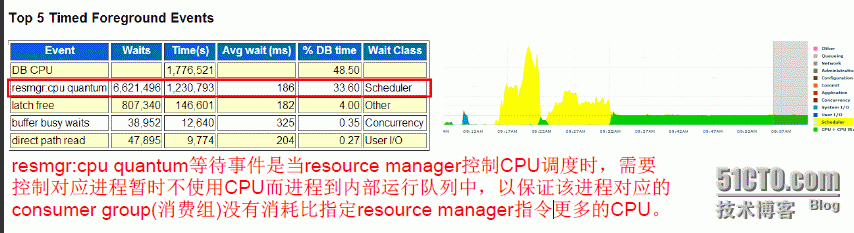
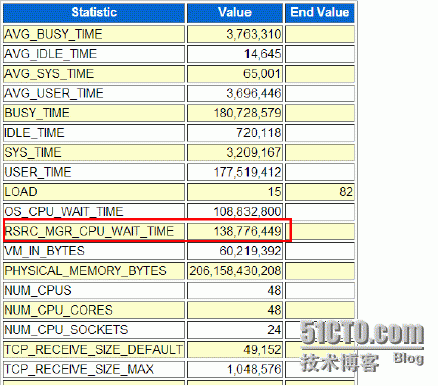
5.%DB time waiting for CPU (Resource Manager)是指當使用了resource manager限制某個用戶和會話使用CPU,而產生的等待。會產生resmgr:cpu quantum等待事件,如果產生該等待事件需要和RSRC_MGR的值結合起來判斷。解決方法是需要修改資源限制的plan。
案例如下圖:
650) this.width=650;" src="http://img1.51cto.com/attachment/201308/133021875.png" title="3344.png" />650) this.width=650;" src="http://img1.51cto.com/attachment/201308/133127742.png" title="1122.png" />
本文出自 “無雙城” 博客,請務必保留此出處http://929044991.blog.51cto.com/1758347/1263389