


Sometimes, we will confuse where to open a restaurant while we are rich enough. So, can we find the way to do the assessments? Of course, yes. So, let’s do it.
We will take “Shanghai” and “Tokyo” as our samples. Here is the information from wiki.
Shanghai is one of the four municipalities under the direct administration of the central government of China, the largest city in China by population, and the second most populous city proper in the world, with a population of more than 24 million as of 2017. It is a global financial centre and transport hub, with the world's busiest container port. Located in the Yangtze River Delta, it sits on the south edge of the estuary of the Yangtze in the middle portion of the East China coast. The municipality borders the provinces of Jiangsu and Zhejiang to the north, south and west, and is bounded to the east by the East China Sea.
Tokyo, officially Tokyo Metropolis, one of the 47 prefectures of Japan, has served as the Japanese capital since 1869.As of 2014 the Greater Tokyo Area ranked as the most populous metropolitan area in the world. The urban area houses the seat of the Emperor of Japan, of the Japanese government and of the National Diet. Tokyo forms part of the Kantō region on the southeastern side of Japan's main island, Honshu, and includes the Izu Islands and Ogasawara Islands.Tokyo was formerly named Edo when Shōgun Tokugawa Ieyasu made the city as his headquarters in 1603. It became the capital after Emperor Meiji moved his seat to the city from Kyoto in 1868; at that time Edo was renamed Tokyo. Tokyo Metropolis formed in 1943 from the merger of the former Tokyo Prefecture and the city of Tokyo.
So, next, we will find the useful data of the two cities.
We need to use google map to find the city's location data
We need to use the foursquare venues data to make samples
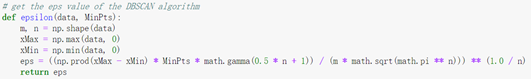
We need to use DBSCAN algorithm to make labels from the matrix sample which from foursquare venues data.
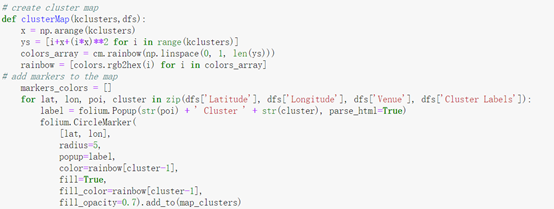
We need to use the folium map data to do the visualization
And we use Python as our program language.
Here we go.
Import all the libraries and functions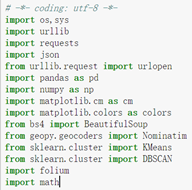

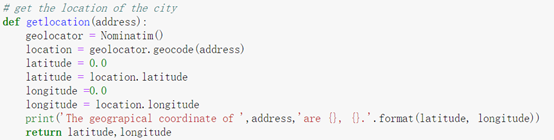

Get the location of Shanghai and Tokyo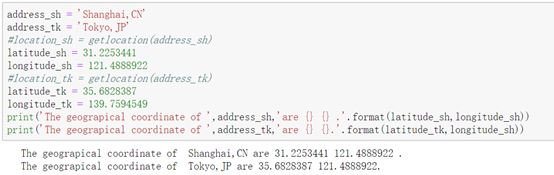
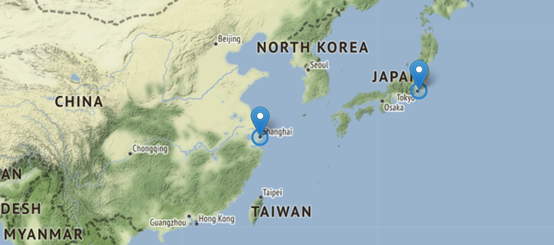
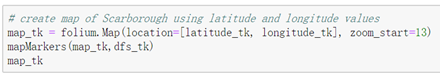
Make the map to display the two cities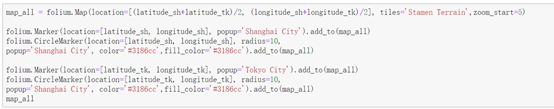
Define the ID of the foursquare API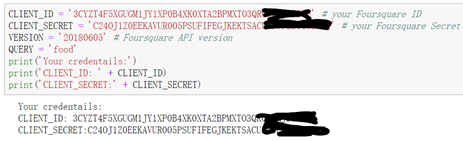

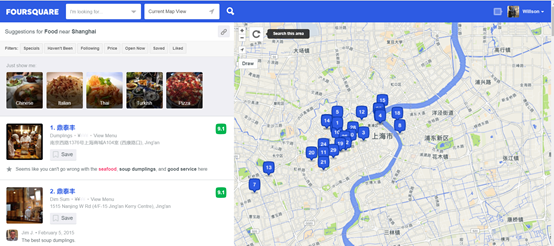
Get the venues of shanghai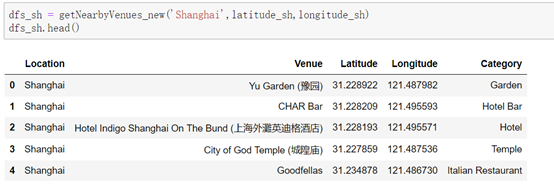
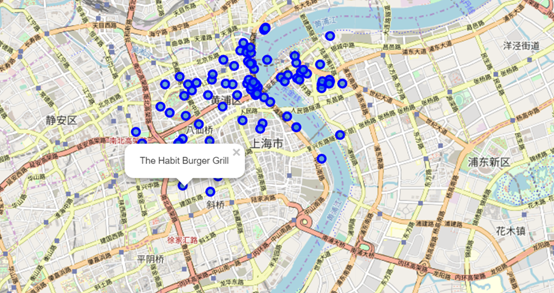
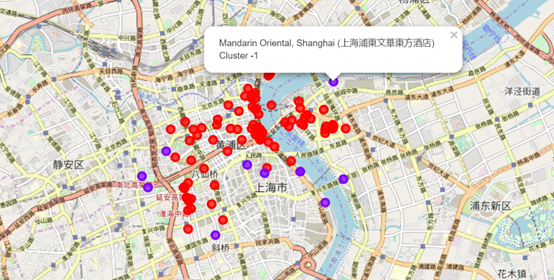
Create the map of Shanghai with venues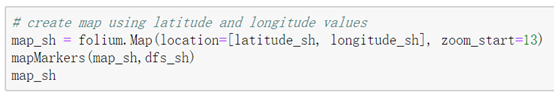
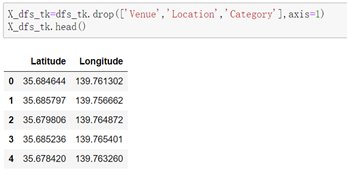
Get the location of each venues, then the dataframe as the sample matrix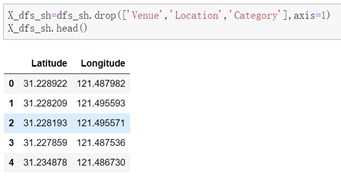
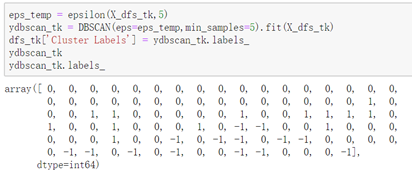
Using the DBSCAN module to cluster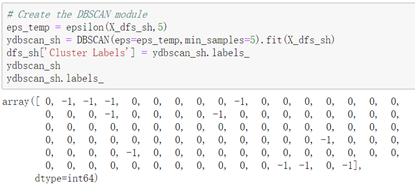
Check the labels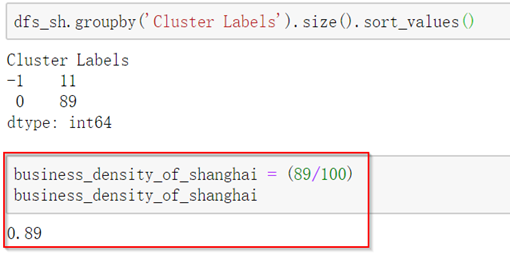
We can get the business density of Shanghai is 0.89.
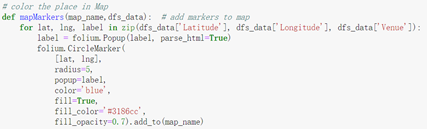
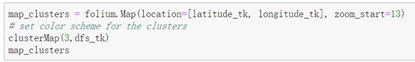
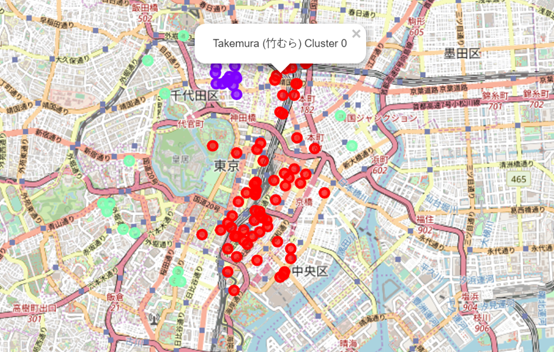
Marked in the map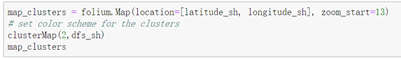
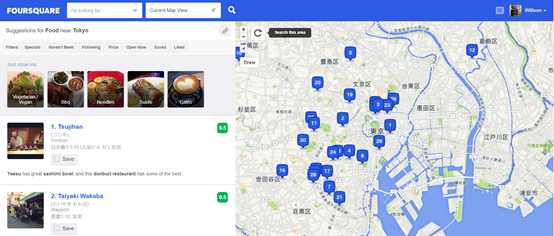
Repeat the actions for Tokyo city.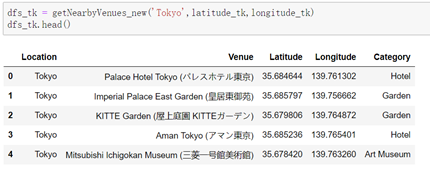
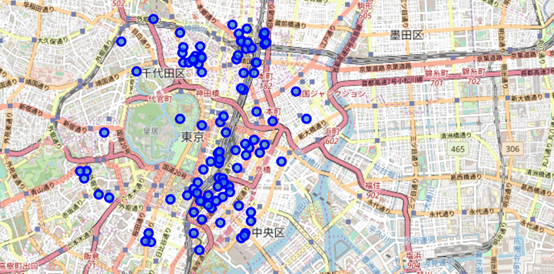
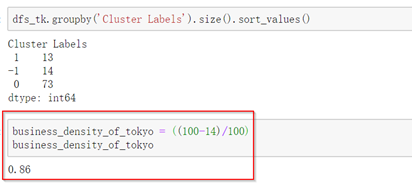
We can get the business density of Tokyo is 0.86.
Result
From the labels, we can know the Shanghai’s business density is 0.89 > Tokyo’s business density 0.86. So, I will choose Shanghai to open a restaurant from the business density data.
Discussion
But business density is only one point of opening restaurant, we should consult more points such as population density, consumption index and so on. Because I can't get the data, so I only use business density to describe the problem.
Conclusion
So, if base on the foursquare venues data, I will use business density to find the city to open a restaurant. So, I will open the restaurant in Shanghai City of China.
Remark:
- I have put my whole scripts to git hub, here is the linkage: https://github.com/willsonluo/Coursera_Capstone/blob/master/Business%20Density%20Analyse/Business%20Density%20of%20Shanghai%20and%20Tokyo.ipynb
- Shanghai information from wiki linkage: https://en.wikipedia.org/wiki/Shanghai
- Tokyo information from wiki linkage: https://en.wikipedia.org/wiki/Tokyo
- DBSCAN algorithm from wiki linkage: https://en.wikipedia.org/wiki/DBSCAN
- Folium Map from GitHub linkage: https://github.com/python-visualization/folium
- Shanghai food information from foursquare linkage: https://foursquare.com/explore?cat=food&mode=url&near=Shanghai%2C%20Shanghai%20Shi%2C%20China&nearGeoId=72057594039724172
![Open restaurant using the business density report]()
- Shanghai food information from foursquare linkage: https://foursquare.com/explore?cat=food&mode=url&near=Tokyo%2C%20T%C5%8Dky%C5%8D%2C%20Japan&nearGeoId=72057594039778083
![Open restaurant using the business density report]()
Hope you will like it. Thank you.
--Willson Luo(羅崇錦) from China.
--2018/11/18