


prometheus監控zookeeper
官方介紹:主要有兩種方式,四字命令和jmx
1、四字命令:
https://zookeeper.apache.org/doc/r3.4.14/zookeeperAdmin.html#sc_zkCommands 其中最常用的三個stat、srvr、cons
Three of the more interesting commands: "stat" gives some general information about the server and connected clients, while "srvr" and "cons" give extended details on server and connections respectively.
$ echo srvr | nc svc-zk.o.svc.mhc.local 2181
Zookeeper version: 3.4.10-39d3a4f269333c922ed3db283be479f9deacaa0f, built on 03/23/2017 10:13 GMT
Latency min/avg/max: 0/0/802
Received: 5833450
Sent: 6074801
Connections: 84
Outstanding: 0
Zxid: 0x2d9407
Mode: standalone
Node count: 12977
2、jmx監控
是利用jvm_exporter暴露指標,參考prometheus官方jmx_exporter https://github.com/prometheus/jmx_exporter
jvm-exporter從基於jvm的應用讀取jmx數據並以http的方式暴露給prometheus抓取
jmx是一種常用的技術,輸出運行中應用的狀態信息,並且可以控制它(例如用jmx觸發gc)
jvm-exporter是用jmx apis收集app和jvm metrics的Java應用,以Java agent方式運行在同一個jvm裏面。
jvm-exporter用Java寫的,以jar包的方式發佈,下載地址
有一個ansible role(https://github.com/alexdzyoba/ansible-jmx-exporter),配置文件包含將JMX MBean重寫爲Prometheus展示格式度量標準的規則。基本上它是將MBeans字符串轉換爲Prometheus字符串的regexp集合。
zookeeper是很多系統的關鍵組成部分,例如Hadoop, Kafka and Clickhouse,因此監控是必不可少的。儘管可以使用4字命令(mntr,stat等)輸出狀態信息,但我更喜歡使用JMX,以避免常見的Zookeeper查詢(它們會向metrics添加噪聲干擾,4字命令被視爲正常的Zookeeper請求)
2.1、以java-agent方式運行(官方推薦):
zookeeper啓動的時候傳入參數啓用,不需要開啓jmx
$ cat java.env
export SERVER_JVMFLAGS="-javaagent:/root/jmx_prometheus_javaagent-0.12.0.jar=7070:/root/config.yaml $SERVER_JVMFLAGS"
查看啓動日誌並檢查結果:
$ netstat -tlnp | grep 7070
tcp        0      0 0.0.0.0:7070            0.0.0.0:*               LISTEN      892/java

$ curl -s localhost:7070/metrics | head
# HELP jvm_threads_current Current thread count of a JVM
# TYPE jvm_threads_current gauge
jvm_threads_current 16.0
# HELP jvm_threads_daemon Daemon thread count of a JVM
# TYPE jvm_threads_daemon gauge
jvm_threads_daemon 12.0
# HELP jvm_threads_peak Peak thread count of a JVM
# TYPE jvm_threads_peak gauge
jvm_threads_peak 16.0
# HELP jvm_threads_started_total Started thread count of a JVM
With jmx-exporter you can scrape the metrics of running JVM applications. jmx-exporter runs as a Java agent (inside the target JVM) scrapes JMX metrics, rewrite it according to config rules and exposes it in Prometheus exposition format.
容器中啓用jvm_exporter
基於官方zookeeper的github倉庫,修改官方dockerfile以加入啓動參數
下面鏈接是我修改後的,親測可用
https://github.com/weifan01/zookeeper-docker/tree/master/3.4.14
構建好的zk-3.4.14版本鏡像: docker pull 3070656869/zookeeper:3.4.14-jvm-exporter
啓動OK後,訪問8080端口查看結果
2.2、以http方式獨立運行
參考官方文檔:https://github.com/prometheus/jmx_exporter
git clone https://github.com/prometheus/jmx_exporter.git
cd jmx_exporter
mvn package
#修改配置文件example_configs/httpserver_sample_config.yml
#修改啓動腳本里面的監聽地址和端口
sh run_sample_httpserver.sh我測試配置如下:
$ cat http_server_config.yaml
---
# jmx地址和端口
hostPort: 172.21.10.248:6666
username:
password:

rules:
  # replicated Zookeeper
  - pattern: "org.apache.ZooKeeperService<name0=ReplicatedServer_id(\\d+)><>(\\w+)"
    name: "zookeeper_$2"
  - pattern: "org.apache.ZooKeeperService<name0=ReplicatedServer_id(\\d+), name1=replica.(\\d+)><>(\\w+)"
    name: "zookeeper_$3"
    labels:
      replicaId: "$2"
  - pattern: "org.apache.ZooKeeperService<name0=ReplicatedServer_id(\\d+), name1=replica.(\\d+), name2=(\\w+)><>(\\w+)"
    name: "zookeeper_$4"
    labels:
      replicaId: "$2"
      memberType: "$3"
  - pattern: "org.apache.ZooKeeperService<name0=ReplicatedServer_id(\\d+), name1=replica.(\\d+), name2=(\\w+), name3=(\\w+)><>(\\w+)"
    name: "zookeeper_$4_$5"
    labels:
      replicaId: "$2"
      memberType: "$3"
  # standalone Zookeeper
  - pattern: "org.apache.ZooKeeperService<name0=StandaloneServer_port(\\d+)><>(\\w+)"
    name: "zookeeper_$2"
  - pattern: "org.apache.ZooKeeperService<name0=StandaloneServer_port(\\d+), name1=InMemoryDataTree><>(\\w+)"
    name: "zookeeper_$2"
啓動:
java -Dcom.sun.management.jmxremote.ssl=false -Dcom.sun.management.jmxremote.authenticate=false -Dcom.sun.management.jmxremote.port=6667 -jar jmx_prometheus_httpserver-0.12.1-SNAPSHOT-jar-with-dependencies.jar 172.21.10.248:6668 http_server_config.yaml訪問: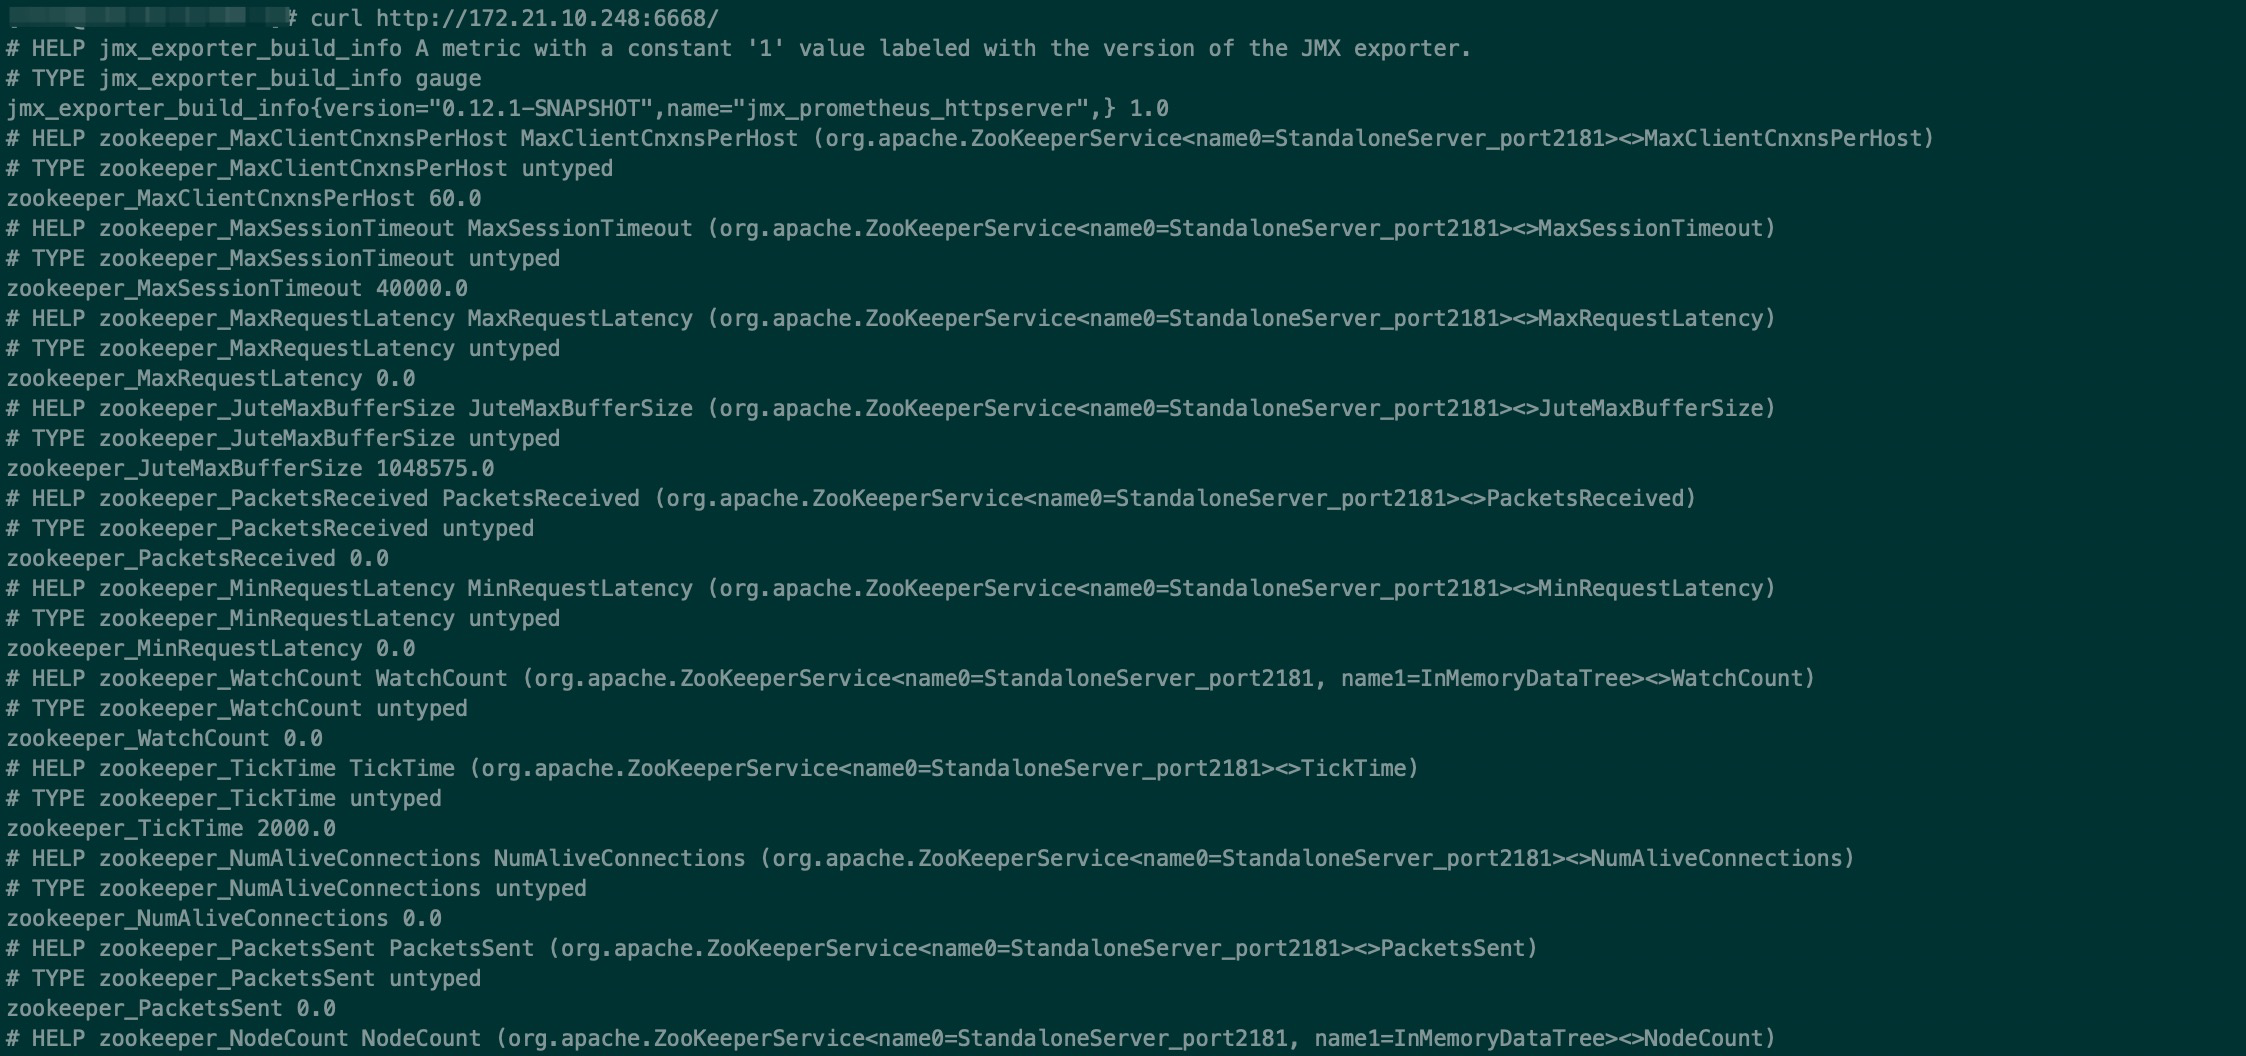
prometheus監控
在kubernetes集羣中,抓取集羣中每個zk的指標,通過service訪問不清楚是具體哪個zk節點上的數據,因此需要根據pod的域名去訪問,statefulset類型的pod都有一個dns記錄,訪問pod的域名格式爲:podname.headless-name.namespace.svc.mhc.local
prometheus配置中添加:
    - job_name: zk-s
      static_configs:
      - targets:
        - stateful-zk-0.svc-zk.s.svc.mhc.local:8081
        - stateful-zk-1.svc-zk.s.svc.mhc.local:8081
        - stateful-zk-2.svc-zk.s.svc.mhc.local:8081
發送reload信號給prometheus
在prometheus控制檯target中可以看到已經有任務up了
如有誤,請指正,謝謝!