一、二進制包安裝
我們可以到 Prometheus 二進制安裝包下載頁面,根據自己的操作系統選擇下載對應的安裝包。下面我們將以 Amazon Linux 2 作爲演示。
我們以現在的時間爲準,下載最新版本 v2.17.1。
1.1、下載 Prometheus Server
wget https://github.com/prometheus/prometheus/releases/download/v2.17.1/prometheus-2.17.1.linux-amd64.tar.gz

tar xf prometheus-2.17.1.linux-amd64.tar.gz
mv prometheus-2.17.1.linux-amd64/prometheus /usr/local/bin/
1.2、配置啓動文件
因爲是生產環境,我們爲其配置啓動文件。
vim /etc/systemd/system/prometheus.service[Unit]
Description=Prometheus Server
After=network.target
Documentation=https://prometheus.io/docs/introduction/overview/
[Service]
Type=simple
WorkingDirectory=/home/data/prometheus/
ExecStart=/usr/local/bin/prometheus \
--config.file=/etc/prometheus/prometheus.yml \
--web.read-timeout=5m \
--web.max-connections=512 \
--storage.tsdb.retention=15d \
--storage.tsdb.path=/home/data/prometheus \
--query.timeout=2m
Restart=on-failure
[Install]
WantedBy=multi-user.target1.3、配置文件
Prometheus 通過在目標節點的 HTTP 端口上採集 metrics(遙測專用詞,度量指標)來監控目標節點(以下會稱爲“採樣目標”)。因爲 Prometheus 也以相同的方式暴露自己的數據,所以他也可以採集和檢查自己的健康狀況。
我們把配置文件轉移到標準目錄/etc/prometheus/
mkdir /etc/prometheus
mv prometheus-2.17.1.linux-amd64/prometheus.yml /etc/prometheus
初始的配置文件比較簡單,如下,自帶了一個 job,來監控 prometheus server 的狀態。
global:
  scrape_interval:     15s
  evaluation_interval: 15s

alerting:
  alertmanagers:
  - static_configs:
    - targets:

rule_files:

scrape_configs:
  - job_name: 'prometheus'
    static_configs:
      - targets: ['localhost:9090']
1.4、啓動
systemctl daemon-reload
systemctl start prometheus
systemctl enable prometheus
1.5、查看
啓動好之後,prometheus 服務會監聽在端口 9090,我們使用 IP + Port,即可查看 prometheus 簡單的圖像界面:
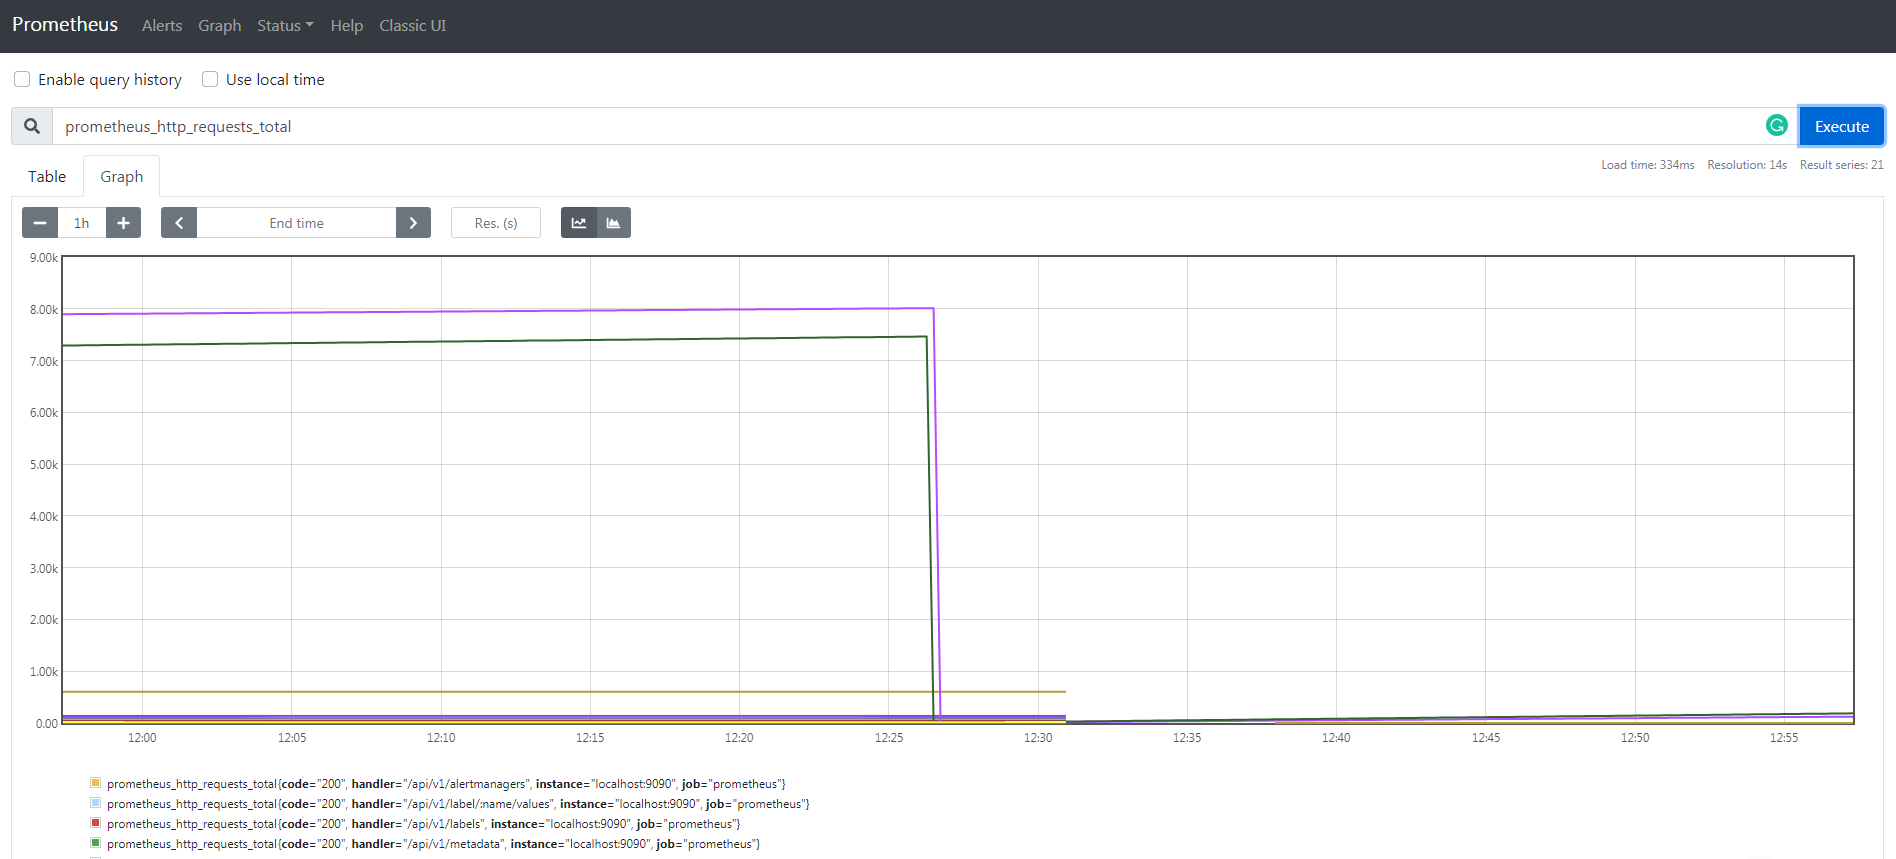
- 可以看出 Prometheus 二進制安裝非常方便,沒有依賴,自帶查詢 web 界面。
- 在生產環境中,我們可以將 Prometheus 添加到 init 配置裏,或者使用 supervisord 作爲服務自啓動。
二、Docker 安裝
首先確保你已安裝了最新版本的 Docker, 如果沒有安裝請點擊這裏。
下面我將以 Mac 版本的 Docker 作爲演示。
2.1、安裝
docker run \
    -p 9090:9090 \
    -v /etc/prometheus/prometheus.yml:/etc/prometheus/prometheus.yml \
    prom/prometheus
2.2、Docker 管理 prometheus
運行 docker ps 查看所有服務:
CONTAINER ID        IMAGE                           COMMAND                  CREATED             STATUS              PORTS                      NAMES
e9ebc2435387        quay.io/prometheus/prometheus   "/bin/prometheus -..."   26 minutes ago      Up 26 minutes       0.0.0.0:9090->9090/tcp   prometheus
運行 docker start prometheus 啓動服務
運行 docker stats prometheus 查看 prometheus 狀態
運行 docker stop prometheus 停止服務
三、node_export 安裝
node_exporter 主要用於 *NIX 系統監控, 用 Golang 編寫。
3.1、二進制安裝
下載地址:https://prometheus.io/download/
wget https://github.com/prometheus/node_exporter/releases/download/v0.18.1/node_exporter-0.18.1.linux-amd64.tar.gz

tar xf node_exporter-0.18.1.linux-amd64.tar.gz

mv node_exporter-0.18.1.linux-amd64/node_exporter /usr/local/bin/
3.2、配置啓動文件
vim /etc/systemd/system/node_export.service[Unit]
Description=Node Export
After=network.target
Documentation=https://prometheus.io/docs/guides/node-exporter/
[Service]
Type=simple
WorkingDirectory=/tmp/
ExecStart=/usr/local/bin/node_exporter
Restart=on-failure
[Install]
WantedBy=multi-user.targetsystemctl daemon-reload
systemctl start node_export
systemctl enable node_export3.3、加入監控
我們手動加入 prometheus 監控,修改其配置文件,再尾部增加如下內容:
  - job_name: 'node_export'
    static_configs:
      - targets:
        - localhost:9100
        - web1:9100
        - web2:9100
        - web3:9100
        - web4:9100
prometheus 服務器需要可以解析這些地址,我們可以修改其 /etc/hosts 文件。
3.4、Docker安裝
docker run -d \
  --net="host" \
  --pid="host" \
  -v "/:/host:ro,rslave" \
  quay.io/prometheus/node-exporter \
  --path.rootfs=/host
四、grafana rpm 安裝
4.1、下載
下載地址:https://grafana.com/grafana/download
我推薦使用 rpm 包進行安裝,這樣很多依賴可以自動解決,而且也配置好了啓動腳本。
wget https://dl.grafana.com/oss/release/grafana-6.7.2-1.x86_64.rpm
sudo yum install grafana-6.7.2-1.x86_64.rpm
4.2、啓動
systemctl enable grafana-server
systemctl start grafana-server
4.3、訪問
訪問 IP + Port,grafana 默認的啓動 port 是 3000,初始賬號和密碼都是 admin,下面是登陸之後的界面,我這裏截圖是已經配置好數據源的。

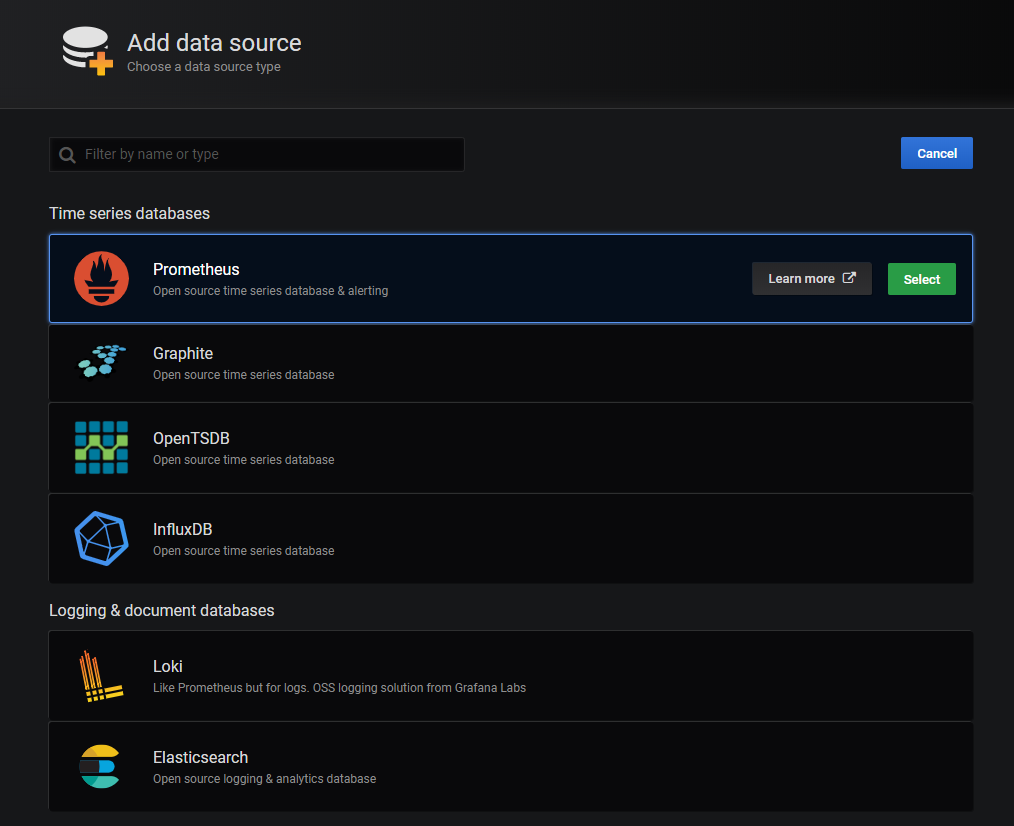
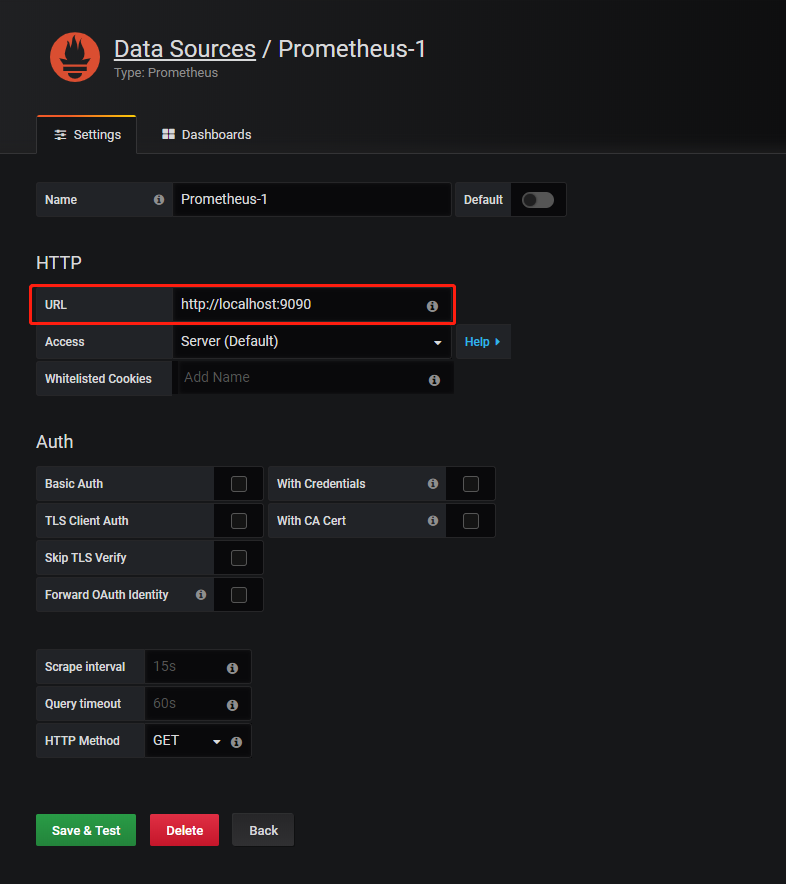
4.4、配置數據源
grafana 支持的數據源非常多,我們這裏選擇 prometheus。
因爲我們的 grafana 和 prometheus 在同一臺機器上面,地址填寫 localhost:9090 即可。
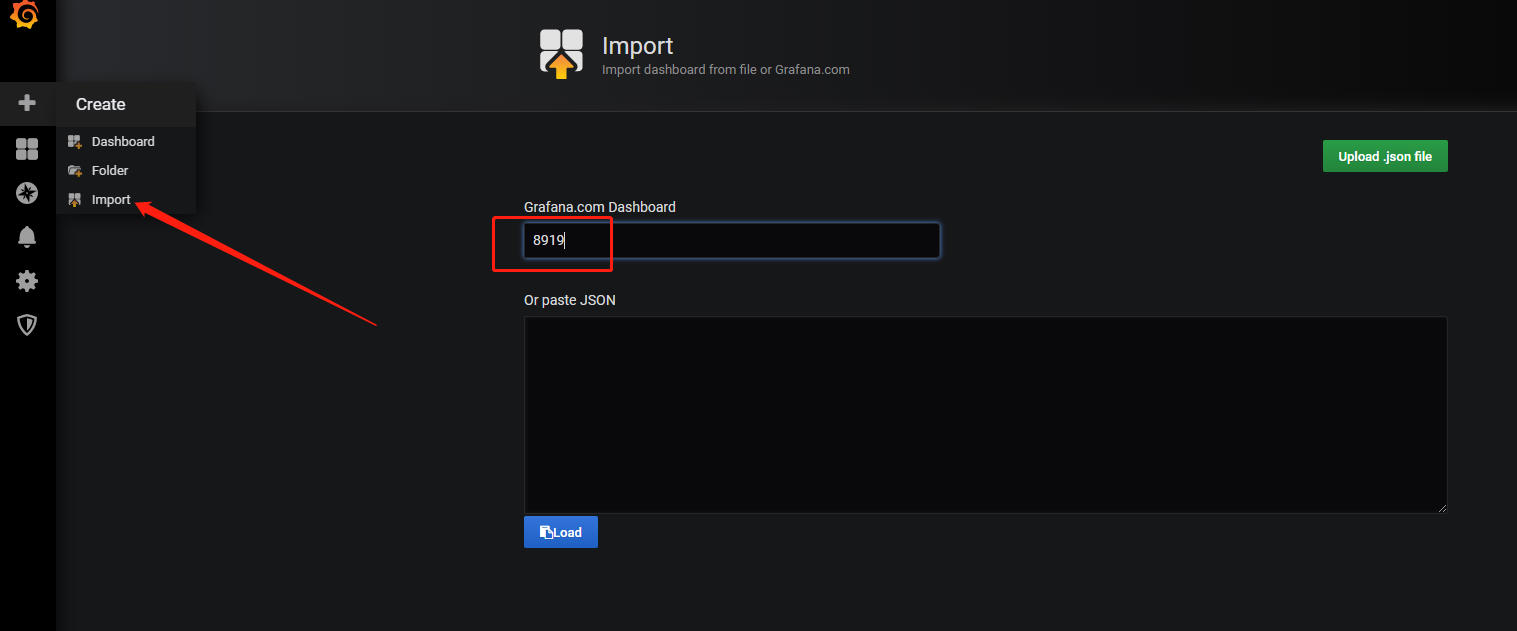
4.5、導入模板
開始我們可能不會製作模板,我們先導入一個模板,只需要輸入其編號即可。更多的官方 Dashboard 請參見:
https://grafana.com/grafana/dashboards?orderBy=name&direction=asc
4.6、查看效果
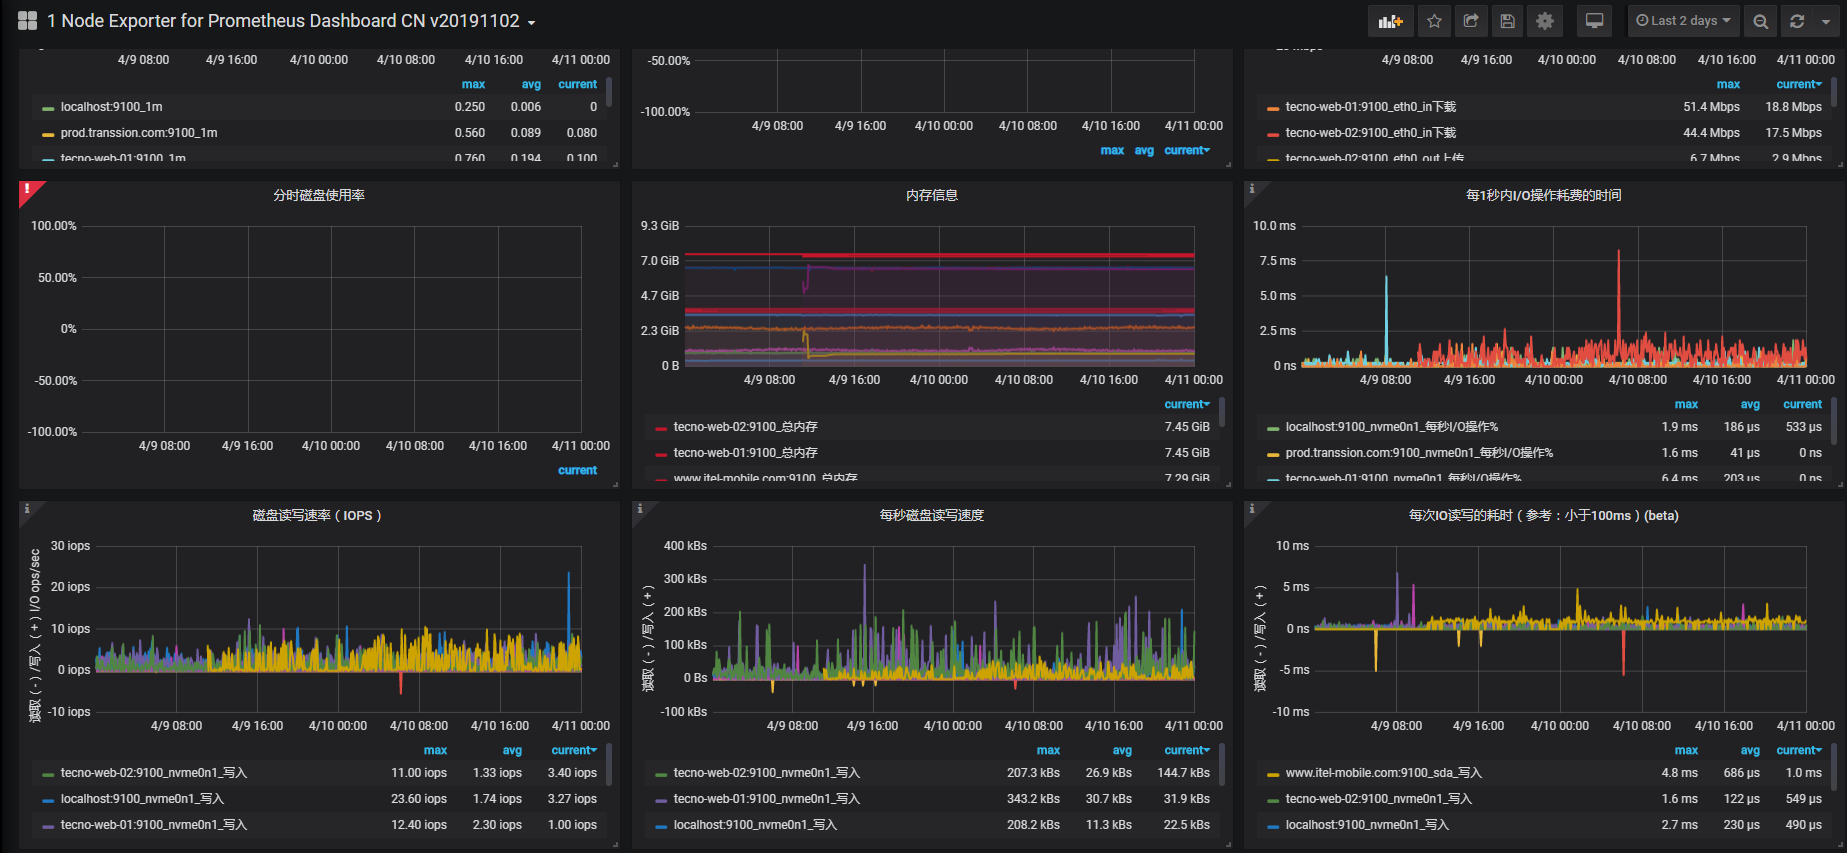
歡迎大家掃碼關注,獲取更多信息