MVC【THINKPHP】同樣受用
XDEBUG配置:
1.安裝 xdebug 略了。網上有很多資料。
重點寫php.ini的配置
[XDebug]
zend_extension="/usr/lib/php5/20090626+lfs/xdebug.so"
xdebug.default_enable = On
xdebug.collect_params = On
xdebug.remote_connect_back = On //如果開啓此,將忽略下面的 xdebug.remote_host 的參數。 <一臺webserver有多個開發者的工作目錄的時候使用,如:p1.xx.com,p2.xx.com,p3.xx.com 。。。等。 >
xdebug.remote_host = 192.168.59.104 //注意這裏是,客戶端的ip<即IDE的機器的ip,不是你的web server>
xdebug.remote_port = 9900 // 注意這裏是,客戶端的端口<即IDE的機器的ip,不是你的web server>
xdebug.remote_enable = On
xdebug.remote_handler = dbgp
xdebug.remote_log = "/var/www/xdebug/xdebug.log"
xdebug.remote_req = req
xdebug.auto_trace = Off
xdebug.remote_autostart = On
xdebug.show_exception_trace = 0
xdebug.collect_vars = On
xdebug.collect_return = On
xdebug.collect_params = On
xdebug.var_display_max_depth = 15
xdebug.show_local_vars = 1
xdebug.dump_undefined = 1
xdebug.profiler_enable = 1
xdebug.profiler_output_dir = /var/www/xdebug
PHPSTORM 配置:
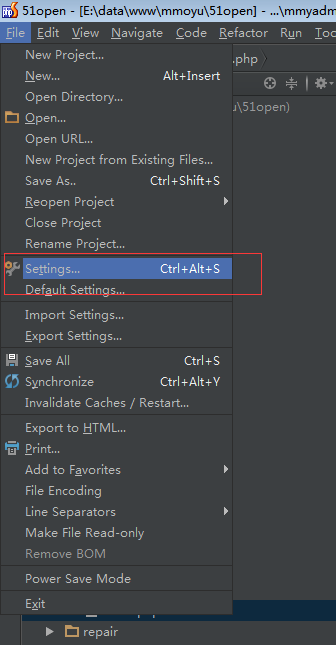
1.file->setings->php|Debug右側。xdebug的那一塊。 設置Debug port:9900(這裏設置 的是,xdebug 吐出的debug信息,通過本機的什麼端口傳輸。)
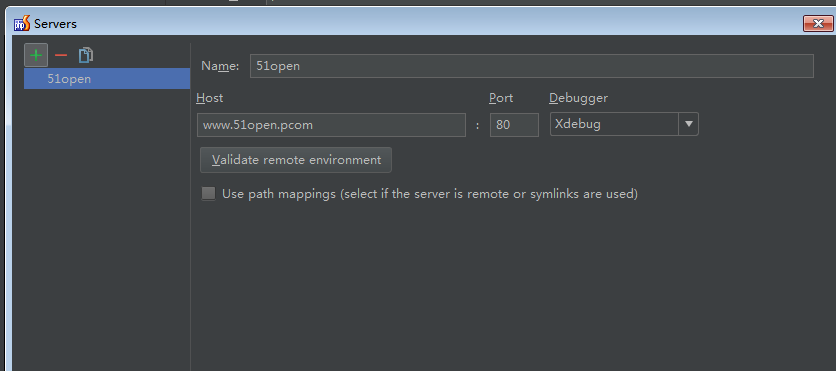
2.file->setings->php|Servers 右側。 host: 你的web服務器的域名或ip ,端口, 下面的 use path mapping 意的是,你的項目的目錄,對應服務器上的,什麼目錄? 這裏一定要設置哦! 不然,會發生找不到文件而出錯,導至調試終止。
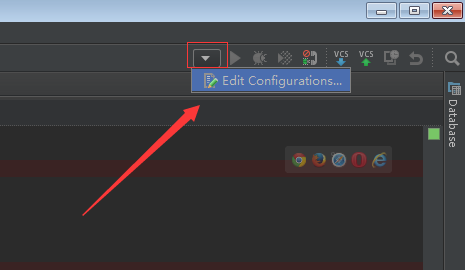
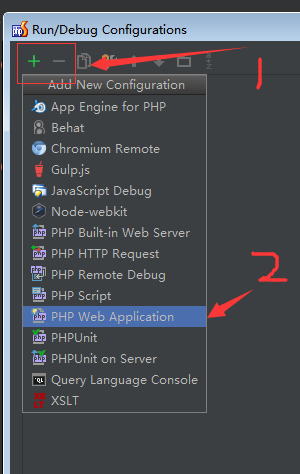
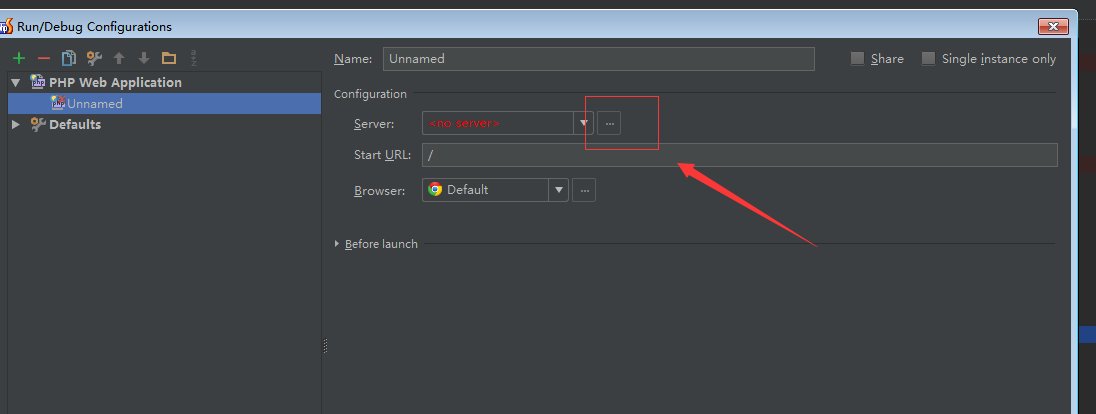
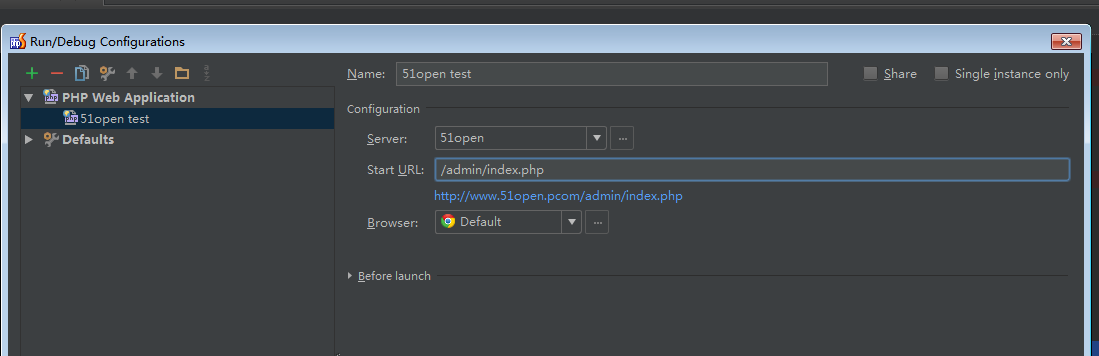
3.Run->Edit Configurations-> 增加一個 PHP WEB APPlication 的調試點。 右側: server 選擇你上面建立的server. starturl 設置你的入口文件。
至此,配置完畢!
這樣的請求,可以註冊一個調試客戶端哦!
http://www.aihuxi.com/****.php?XDEBUG_SESSION_START=19192
點擊,小蟲子圖標,即可,開始調試!
運行環境:
PHPSTORM版本 : 8.0.1
PHP版本 : 5.6.2
xdebug版本:php_xdebug-2.2.5-5.6-vc11-x86_64.dll
ps : php版本和xdebug版本一定要相對應
1. PHP安裝xdebug擴展
php.ini的配置,下面的配置僅供參考,路徑要換成自己的!
[xdebug]
zend_extension="D:\wamp\php-5.6.2-x64\ext\php_xdebug-2.2.5-5.6-vc11-x86_64.dll"
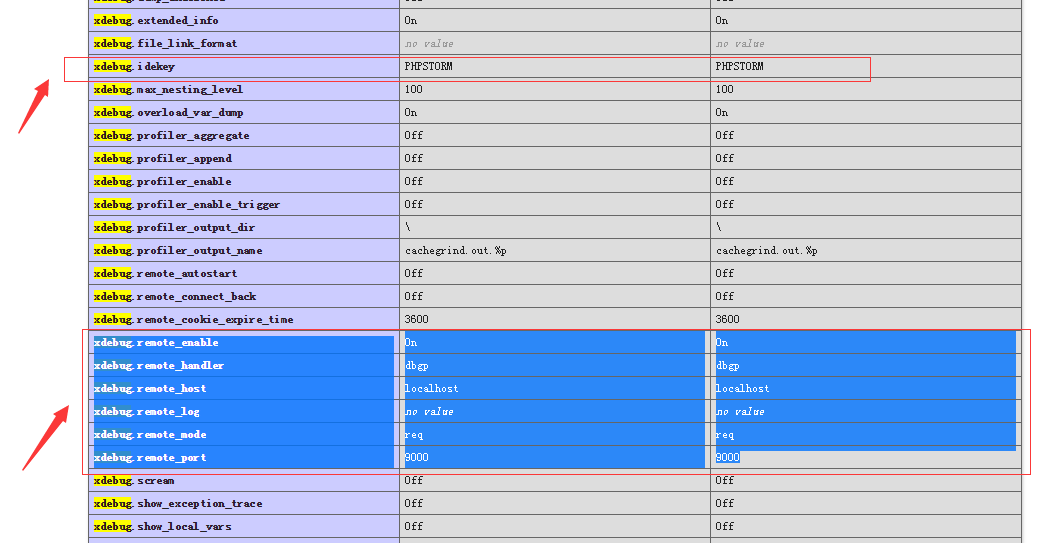
xdebug.remote_enable = On
xdebug.remote_handler = dbgp
xdebug.remote_host= localhost
xdebug.remote_port = 9000
xdebug.idekey = PHPSTORM
ps : remote_handler 、remote_host、remote_port 這些都有默認值,但還是建議設置下,至少知道要設置這些參數~
查看phpinfo~
2.PHPSTORM設置
樓主以前一直用zendstudio,剛開始用phpstorm非常蛋疼,用了一段時間後發現還挺好用的~
1.首先檢查phpstorm的xdebug配置
這裏的debug port要和php.ini裏面的xdebug.remote_port相一致!默認是9000,如果9000端口被佔用的話,可以改成其他端口。

2. 設置debug.
添加本地的 web server~
www.51open.pcom 是我本地的 web server~ ~
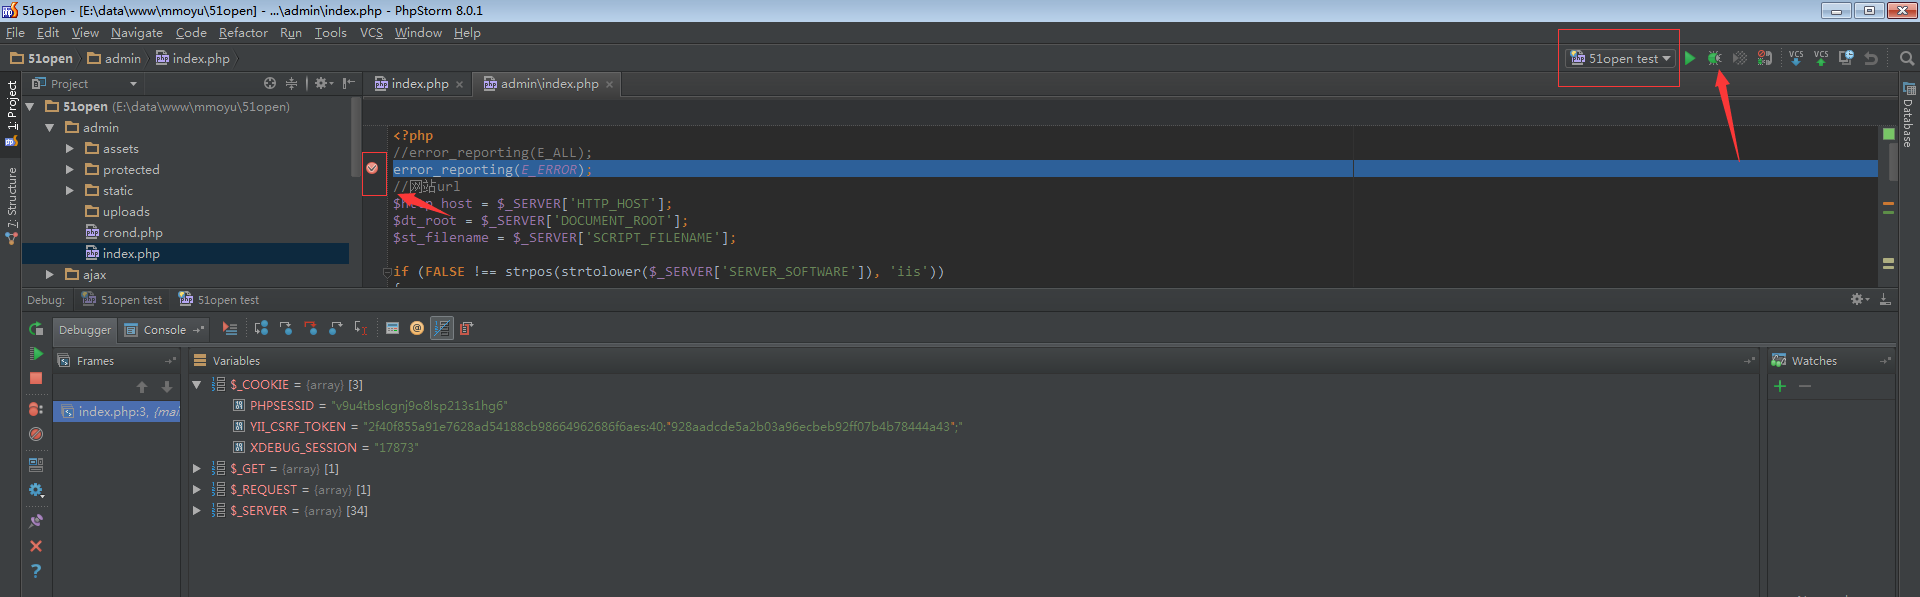
3.開始調試
-
打好第一個斷點,shift + F9就可以了
-
打好第一個斷點,選中配置的debug, 按旁邊的臭蟲 按鈕