


2019.11.14晚21:00直播《任务管理系统》。
一、简介
在上一篇Prometheus+Node_exporter+Grafana+Alertmanager 监控部署里,已经有了 promethues 的一套监控环境。但是这里有个问题,就是在 prometheus.yml 里配置需要监听的服务时,是按服务名写死的,如果后面增加了节点或者组件信息,就得手动修改此配置,并重启 promethues;那么能否动态的监听微服务呢?Prometheus 提供了多种动态服务发现的功能,这里以 consul 为例。
二、引入 consul 的好处
在没有使用 consul 服务自动发现的时候,我们需要频繁对 Prometheus 配置文件进行修改,无疑给运维人员带来很大的负担,还有可能直接变成一个"配置达人",即使是配置达人也会存在人为失误的情况。
三、Prometheus 支持的多种服务发现机制
#Prometheus数据源的配置主要分为静态配置和动态发现, 常用的为以下几类:
static_configs: #静态服务发现
file_sd_configs: #文件服务发现
dns_sd_configs: DNS #服务发现
kubernetes_sd_configs: #Kubernetes 服务发现
consul_sd_configs: Consul #服务发现
...

#在监控kubernetes的应用场景中,频繁更新的pod,svc,等等资源配置应该是最能体现Prometheus监控目标自动发现服务的好处
四、基于 docker 的 consul 集群
这里使用 docker-compose 方式部署 consul 集群
cat > /data0/consul/docker-compose.yaml << \EOF
version: '2'
networks:
  byfn:

services:
  consul1:
    image: consul
    container_name: node1
    volumes:
      - /data0/consul/conf_with_acl:/consul/config
    command: agent -server -bootstrap-expect=3 -node=node1 -bind=0.0.0.0 -client=0.0.0.0 -config-dir=/consul/config
    networks:
      - byfn

  consul2:
    image: consul
    container_name: node2
    volumes:
      - /data0/consul/conf_with_acl:/consul/config
    command: agent -server -retry-join=node1 -node=node2 -bind=0.0.0.0 -client=0.0.0.0 -config-dir=/consul/config
    ports:
       - 8500:8500
    depends_on:
        - consul1
    networks:
      - byfn

  consul3:
    image: consul
    volumes:
      - /data0/consul/conf_with_acl:/consul/config
    container_name: node3
    command: agent -server -retry-join=node1 -node=node3 -bind=0.0.0.0 -client=0.0.0.0 -config-dir=/consul/config
    depends_on:
        - consul1
    networks:
      - byfn

  consul4:
    image: consul
    container_name: node4
    volumes:
      - /data0/consul/conf_with_acl:/consul/config
    command: agent -retry-join=node1 -node=ndoe4 -bind=0.0.0.0 -client=0.0.0.0 -ui -config-dir=/consul/config
    ports:
      - 8501:8500
    depends_on:
        - consul2
        - consul3
    networks:
      - byfn

  consul5:
    image: consul
    container_name: node5
    volumes:
      - /data0/consul/conf_without_acl:/consul/config
    command: agent -retry-join=node1 -node=ndoe5 -bind=0.0.0.0 -client=0.0.0.0 -ui -config-dir=/consul/config
    ports:
      - 8502:8500
    depends_on:
        - consul2
        - consul3
    networks:
      - byfn
EOF

cd /data0/consul/
docker-compose up -d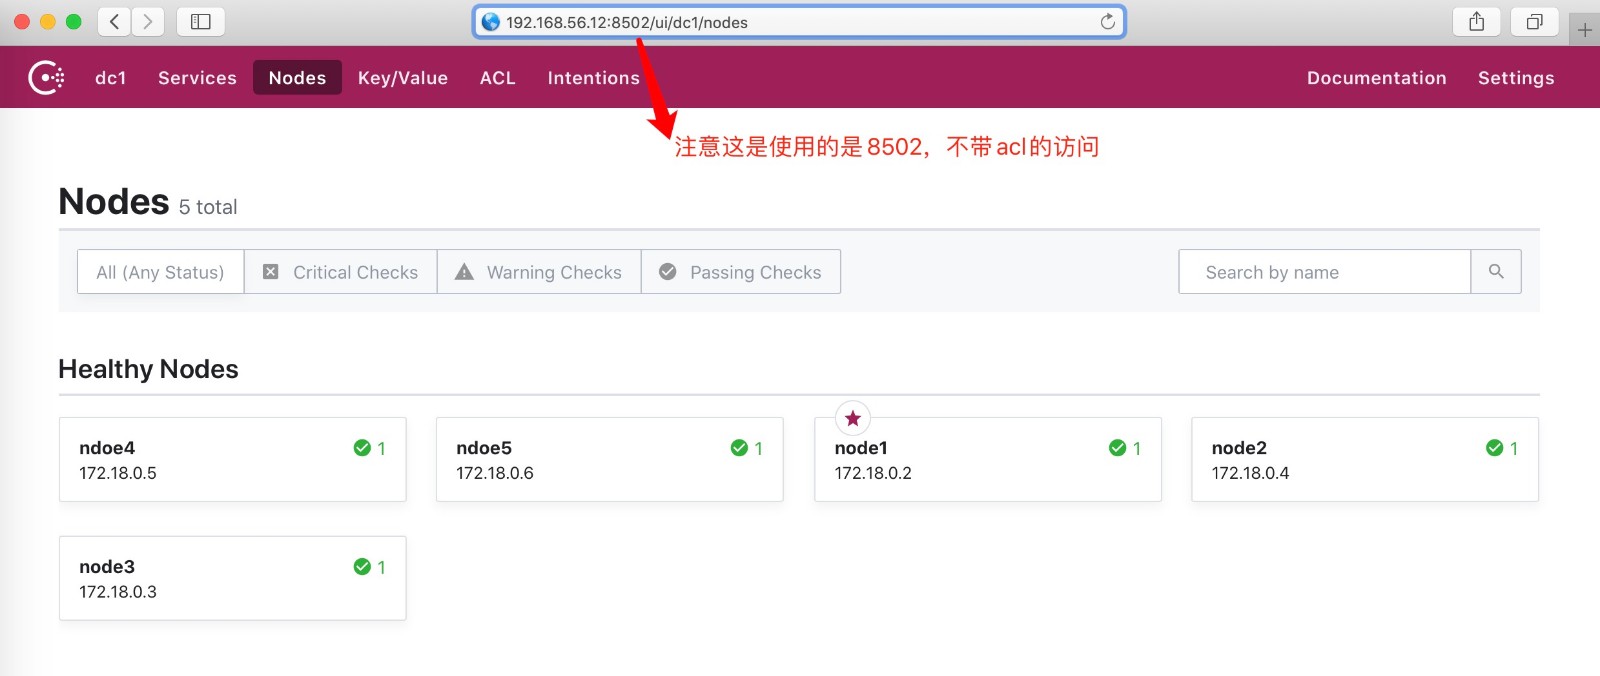
五、使用接口注册服务
# 注册服务
curl -X PUT -d '{"id": "test1","name": "test1","address": "192.168.56.12","port": 9100,"tags": ["service"],"checks": [{"http": "http://192.168.56.12:9100/","interval": "5s"}]}' http://192.168.56.12:8502/v1/agent/service/register

# 查询指定节点以及指定的服务信息
root># curl http://192.168.56.12:8500/v1/catalog/service/test1

[{"ID":"62c9ea24-a464-ee3f-a7ac-44b608b2a9fc","Node":"ndoe5","Address":"172.18.0.6","Datacenter":"dc1","TaggedAddresses":{"lan":"172.18.0.6","wan":"172.18.0.6"},"NodeMeta":{"consul-network-segment":""},"ServiceKind":"","ServiceID":"test1","ServiceName":"test1","ServiceTags":["service"],"ServiceAddress":"192.168.56.12","ServiceWeights":{"Passing":1,"Warning":1},"ServiceMeta":{},"ServicePort":9100,"ServiceEnableTagOverride":false,"ServiceProxy":{"MeshGateway":{}},"ServiceConnect":{},"CreateIndex":261,"ModifyIndex":261}]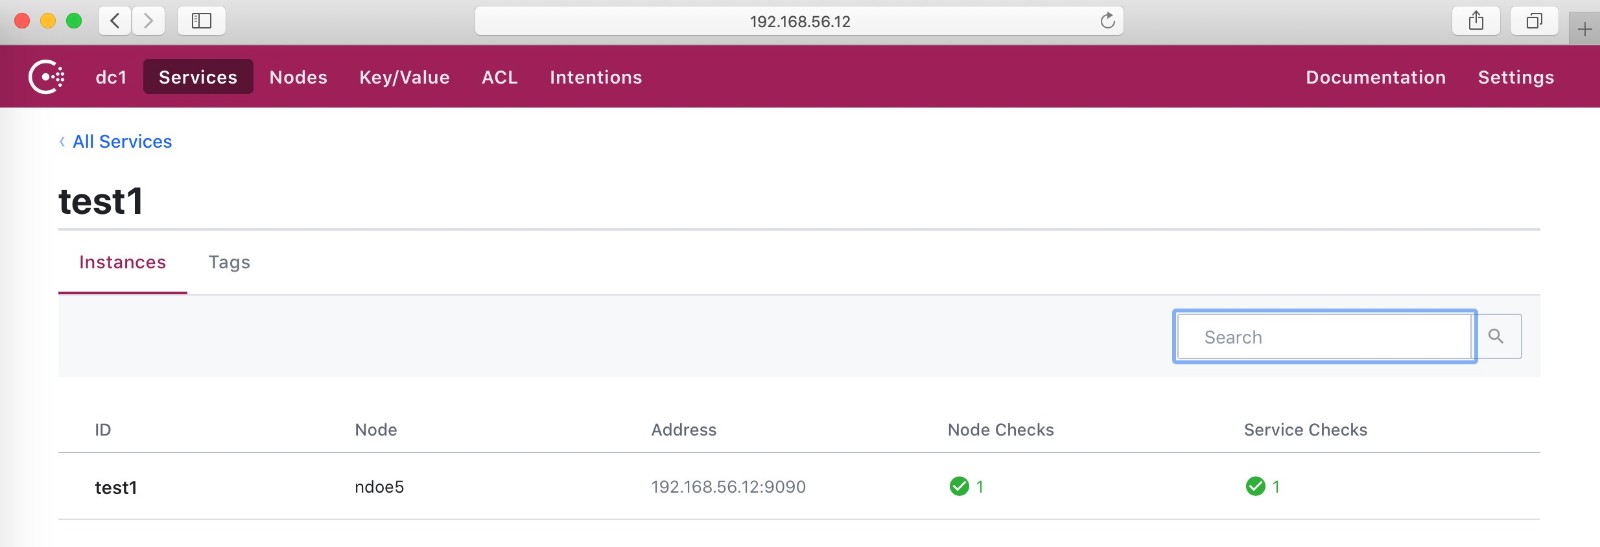
六、修改 prometheus 使用 consul 服务发现
cat > /home/prometheus/prometheus.yml <<\EOF
scrape_configs:
# The job name is added as a label `job=<job_name>` to any timeseries scraped from this config.
   - job_name: 'prometheus'
     static_configs:
      - targets: ['localhost:9090']

   # 匹配service关键字
   - job_name: 'consul-prometheus'
     consul_sd_configs:
       - server: '192.168.56.12:8502'
         services: []
EOF

#重启prometheus
docker restart prometheus
七、结合 grafana 最终展示
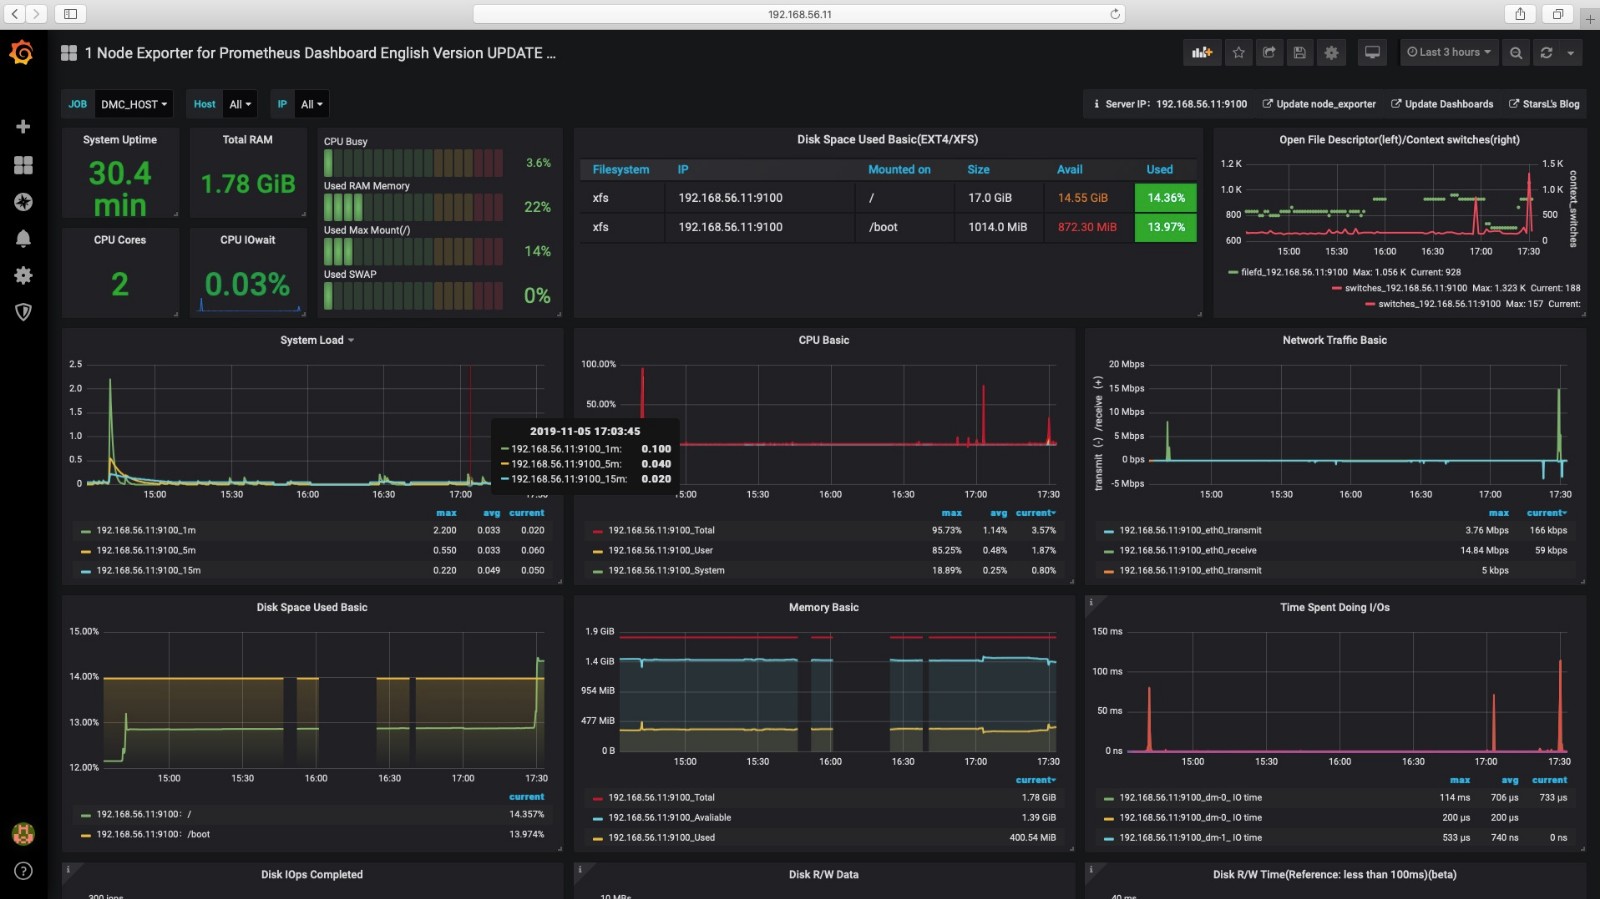
参考文档:
https://kuboard.cn/ (强烈推荐一位大佬新品,快速在 Kubernetes 上落地微服务)
https://www.jianshu.com/p/d4b85d404f6d Consul常用接口使用
作者:Lancger