使用Grafana和Prometheus對Linux服務器性能進行監控,主要通過node_exporter進行監控,指標如 CPU、內存、磁盤等。Prometheus通過HTTP協議從遠程的機器收集數據並存儲Prometheus本地時序數據庫。
- 安裝啓動node_exporter
需在被監控server上安裝node_exporter。下載node_exporter,下載地址:https://github.com/prometheus/node_exporter/releases/download/v0.18.1/node_exporter-0.18.1.linux-amd64.tar.gzwget https://github.com/prometheus/node_exporter/releases/download/v0.18.1/node_exporter-0.18.1.linux-amd64.tar.gz tar xzvf /root/node_exporter-0.18.1.linux-amd64.tar.gz mv /root/node_exporter-0.18.1.linux-amd64 /opt/prometheus/創建prometheus用戶,用於啓動node_exporter.service服務。
useradd -s /sbin/nologin -M prometheus創建/usr/lib/systemd/system/node_exporter.service文件。
[Unit]
Description=node_exporter
Documentation=https://prometheus.io/
After=network.target
[Service]
Type=simple
User=prometheus
ExecStart=/opt/prometheus/node_exporter/node_exporter
Restart=on-failure
[Install]
WantedBy=multi-user.target
啓動:
systemctl start node_exporter.service
systemctl enable node_exporter.service
每臺機器手動安裝太繁瑣,而且效率低,還要考慮防火牆端口等問題。這裏附上各個機器安裝node_exporter的腳本。
vim install_node_exporter_prometheus.sh#!/bin/bash #Author: Joey-Yu cat << EOF +------------------------------------------------------------------+ | ** Welcome to install prometheus node_exporter for CentOS 7 OS| +------------------------------------------------------------------+ EOF function format() { echo -e "\033[32m Success!!! \033[0m\n" echo "#########################################################" } #mkdir dir echo "set prometheus node-exporter dir" dir=/opt/prometheus/ if [ ! -d $dir ]; then mkdir -p /opt/prometheus/ fi format #download node_exporter-0.18.1.linux-amd64.tar.gz echo "download and tar prometheus node_exporter-0.18.1.linux-amd64.tar.gz in root" #cd /root && wget https://github.com/prometheus/node_exporter/releases/download/v0.18.1/node_exporter-0.18.1.linux-amd64.tar.gz node_exporter_file=/root/node_exporter-0.18.1.linux-amd64.tar.gz if [ ! -f $node_exporter_file ]; then echo "no node_exporter-0.18.1.linux-amd64.tar.gz in root!" exit else cd /root/ tar xzvf /root/node_exporter-0.18.1.linux-amd64.tar.gz mv /root/node_exporter-0.18.1.linux-amd64 /opt/prometheus/ format fi # useadd prometheus echo "useadd prometheus user" useradd -s /sbin/nologin -M prometheus format # chown prometheus and ln -s echo "chown prometheus and ln -s" cd /opt/prometheus/ chown -R prometheus.prometheus /opt/prometheus/node_exporter-0.18.1.linux-amd64/ ln -s /opt/prometheus/node_exporter-0.18.1.linux-amd64/ /opt/prometheus/node_exporter format # config prometheus /usr/lib/systemd/system/node_exporter.service echo "touch /usr/lib/systemd/system/node_exporter.service" touch /usr/lib/systemd/system/node_exporter.service cat > /usr/lib/systemd/system/node_exporter.service << EOF [Unit] Description=node_exporter Documentation=https://prometheus.io/ After=network.target [Service] Type=simple User=prometheus ExecStart=/opt/prometheus/node_exporter/node_exporter Restart=on-failure [Install] WantedBy=multi-user.target EOF systemctl start node_exporter.service systemctl enable node_exporter.service format - prometheus配置
修改prometheus.yml配置文件。主要列出scrape_configs下的配置:- job_name: 'node-db' file_sd_configs: - files: ['/usr/local/prometheus/node-db.yml'] refresh_interval: 5s - job_name: 'node-pre' file_sd_configs: - files: ['/usr/local/prometheus/node-pre.yml'] refresh_interval: 5s - job_name: 'node-application' file_sd_configs: - files: ['/usr/local/prometheus/node-application.yml'] refresh_interval: 5s - job_name: 'node-pro' file_sd_configs: - files: ['/usr/local/prometheus/node-pro.yml'] refresh_interval: 5s從上面配置可看出,不同的應用、不同環境儘量放置一個yml文件中。如應用/usr/local/prometheus/node-application.yml文件:
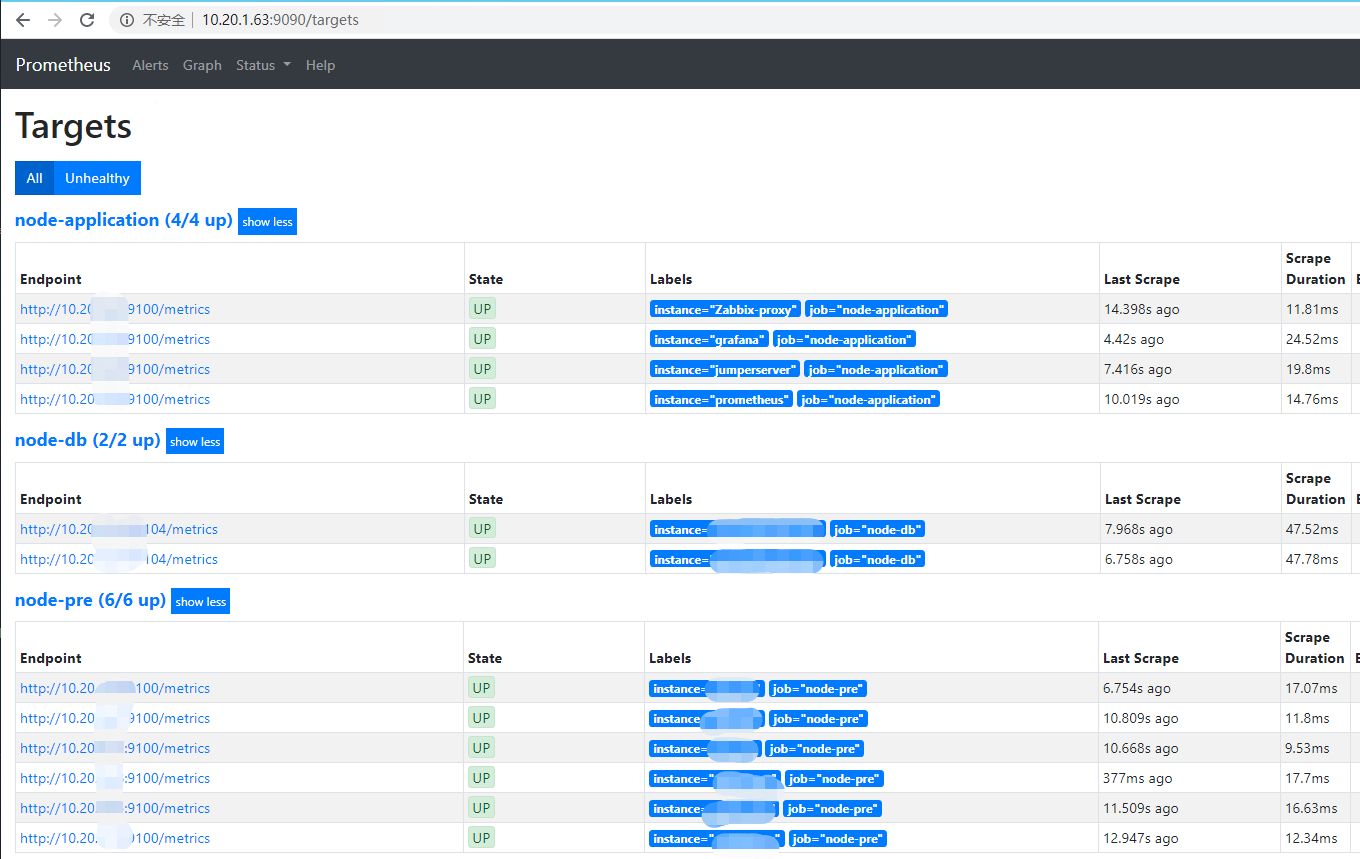
- targets: ["10.20.1.1:9100"]
labels:
instance: grafana
- targets: ["10.20.1.2:9100"]
labels:
instance: Zabbix-proxy
- targets: ["10.20.1.3:9100"]
labels:
instance: prometheus
修改配置後重啓prometheus服務端
systemctl restart prometheus.service - Web界面訪問
使用Prometheus內置了web界面訪問效果。進入Prometheus Web首頁Status => Targets,成功後如下圖:![Grafana+Prometheus監控Linux服務器性能]()
但Prometheus自帶的圖形並不夠強大,這裏結合Grafana作爲Prometheus的Dashboard。 - 配置Grafana
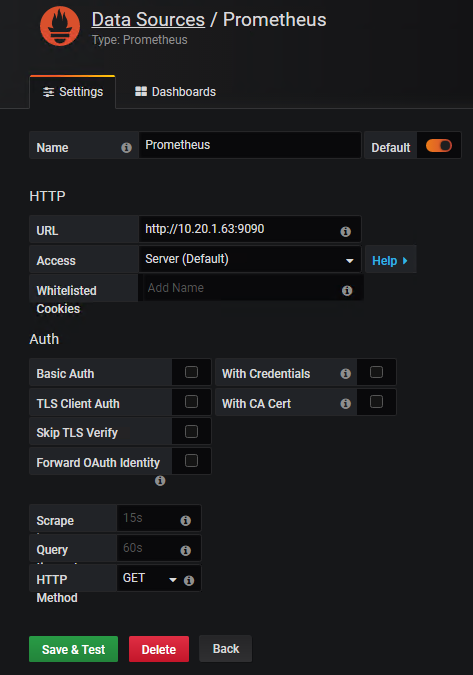
首先在Grafana中添加Prometheus作爲數據源。
進入Grafana,點擊"Add data source"按鈕,跳轉到添加數據源頁面,配置Data Sources選項中添加數據源。
其中URL填寫Prometheus地址,其他項保持默認。單擊 Save & Test 添加成功後如下:![Grafana+Prometheus監控Linux服務器性能]()
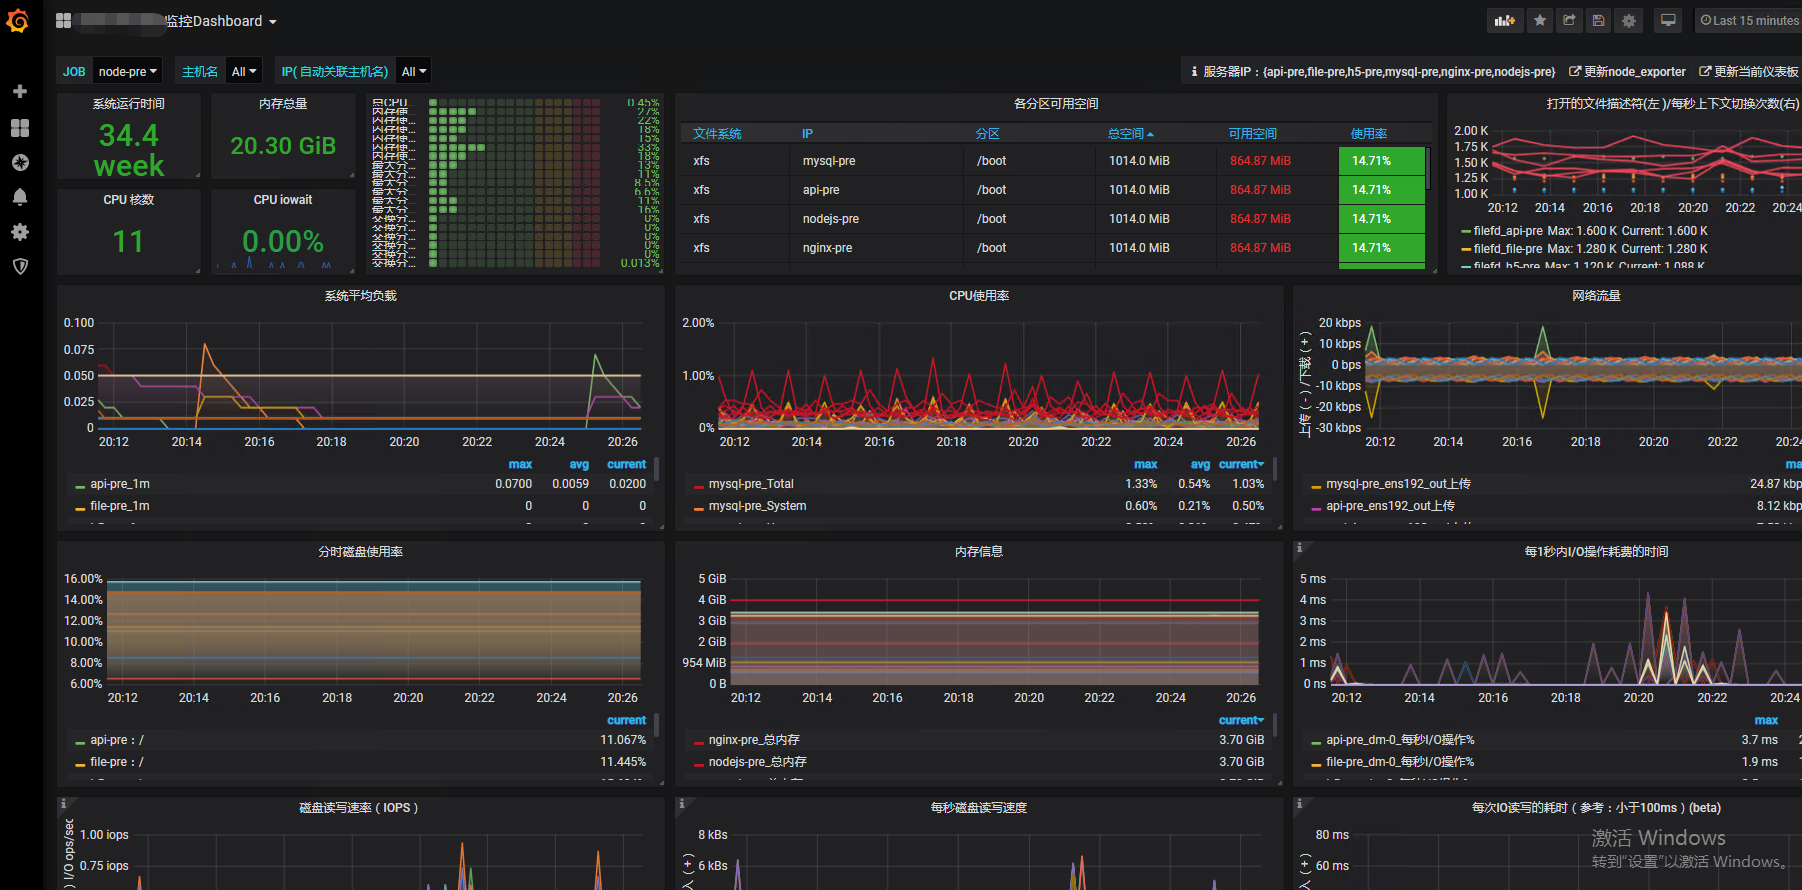
Granfana 導入node_exporter 監控圖表。這裏選擇官網給的 https://grafana.com/grafana/dashboards/8919 監控模板,導出Download JSON。該監控模板有說明支持 Node Exporter v0.16及以上的版本,包含:CPU 內存 磁盤 IO 網絡 流量 溫度等監控指標。
Granfana進入Create->Import導入Dashboards。
node_exporter監控圖表最終效果如下:![Grafana+Prometheus監控Linux服務器性能]()
監控項還是非常詳細,可在左上角選擇不同的node節點下的不同server查看監控。